Should You Be Tempted To Sell Capital City Bank Group, Inc. (NASDAQ:CCBG) Because Of Its P/E Ratio?

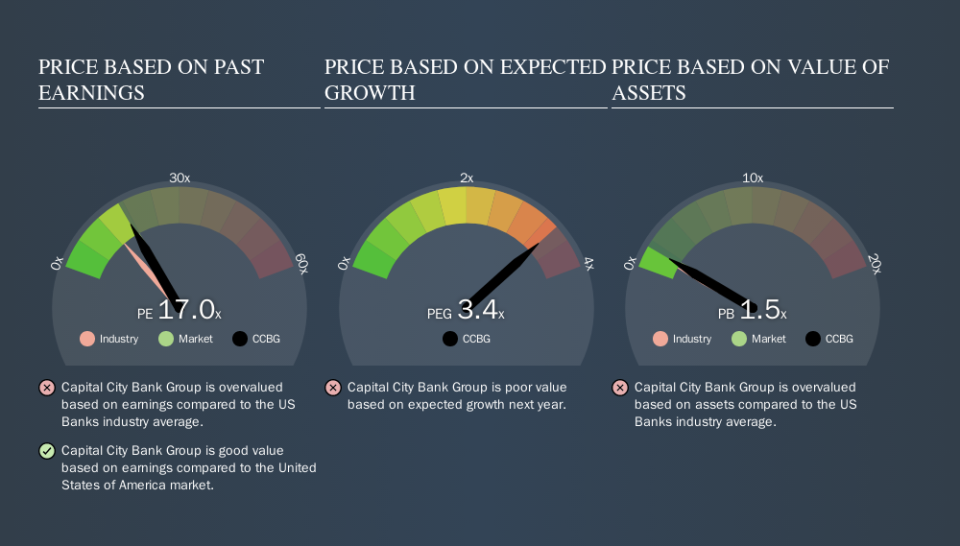
Today, we'll introduce the concept of the P/E ratio for those who are learning about investing. To keep it practical, we'll show how Capital City Bank Group, Inc.'s (NASDAQ:CCBG) P/E ratio could help you assess the value on offer. Looking at earnings over the last twelve months, Capital City Bank Group has a P/E ratio of 17.03. That means that at current prices, buyers pay $17.03 for every $1 in trailing yearly profits.
Check out our latest analysis for Capital City Bank Group
How Do I Calculate A Price To Earnings Ratio?
The formula for P/E is:
Price to Earnings Ratio = Price per Share ÷ Earnings per Share (EPS)
Or for Capital City Bank Group:
P/E of 17.03 = $28.42 ÷ $1.67 (Based on the trailing twelve months to June 2019.)
Is A High Price-to-Earnings Ratio Good?
A higher P/E ratio means that buyers have to pay a higher price for each $1 the company has earned over the last year. That isn't a good or a bad thing on its own, but a high P/E means that buyers have a higher opinion of the business's prospects, relative to stocks with a lower P/E.
Does Capital City Bank Group Have A Relatively High Or Low P/E For Its Industry?
One good way to get a quick read on what market participants expect of a company is to look at its P/E ratio. As you can see below, Capital City Bank Group has a higher P/E than the average company (12.6) in the banks industry.
That means that the market expects Capital City Bank Group will outperform other companies in its industry. Clearly the market expects growth, but it isn't guaranteed. So investors should delve deeper. I like to check if company insiders have been buying or selling.
How Growth Rates Impact P/E Ratios
Probably the most important factor in determining what P/E a company trades on is the earnings growth. Earnings growth means that in the future the 'E' will be higher. And in that case, the P/E ratio itself will drop rather quickly. A lower P/E should indicate the stock is cheap relative to others -- and that may attract buyers.
In the last year, Capital City Bank Group grew EPS like Taylor Swift grew her fan base back in 2010; the 74% gain was both fast and well deserved. The sweetener is that the annual five year growth rate of 25% is also impressive. With that kind of growth rate we would generally expect a high P/E ratio.
A Limitation: P/E Ratios Ignore Debt and Cash In The Bank
Don't forget that the P/E ratio considers market capitalization. Thus, the metric does not reflect cash or debt held by the company. Hypothetically, a company could reduce its future P/E ratio by spending its cash (or taking on debt) to achieve higher earnings.
Such expenditure might be good or bad, in the long term, but the point here is that the balance sheet is not reflected by this ratio.
So What Does Capital City Bank Group's Balance Sheet Tell Us?
With net cash of US$218m, Capital City Bank Group has a very strong balance sheet, which may be important for its business. Having said that, at 46% of its market capitalization the cash hoard would contribute towards a higher P/E ratio.
The Verdict On Capital City Bank Group's P/E Ratio
Capital City Bank Group trades on a P/E ratio of 17.0, which is fairly close to the US market average of 17.7. Its net cash position is the cherry on top of its superb EPS growth. So based on this analysis we'd expect Capital City Bank Group to have a higher P/E ratio.
Investors have an opportunity when market expectations about a stock are wrong. If it is underestimating a company, investors can make money by buying and holding the shares until the market corrects itself. So this free visualization of the analyst consensus on future earnings could help you make the right decision about whether to buy, sell, or hold.
Of course you might be able to find a better stock than Capital City Bank Group. So you may wish to see this free collection of other companies that have grown earnings strongly.
We aim to bring you long-term focused research analysis driven by fundamental data. Note that our analysis may not factor in the latest price-sensitive company announcements or qualitative material.
If you spot an error that warrants correction, please contact the editor at editorial-team@simplywallst.com. This article by Simply Wall St is general in nature. It does not constitute a recommendation to buy or sell any stock, and does not take account of your objectives, or your financial situation. Simply Wall St has no position in the stocks mentioned. Thank you for reading.
