Should You Be Tempted To Sell Carolina Financial Corporation (NASDAQ:CARO) Because Of Its PE Ratio?

I am writing today to help inform people who are new to the stock market and want to start learning about core concepts of fundamental analysis on practical examples from today’s market.
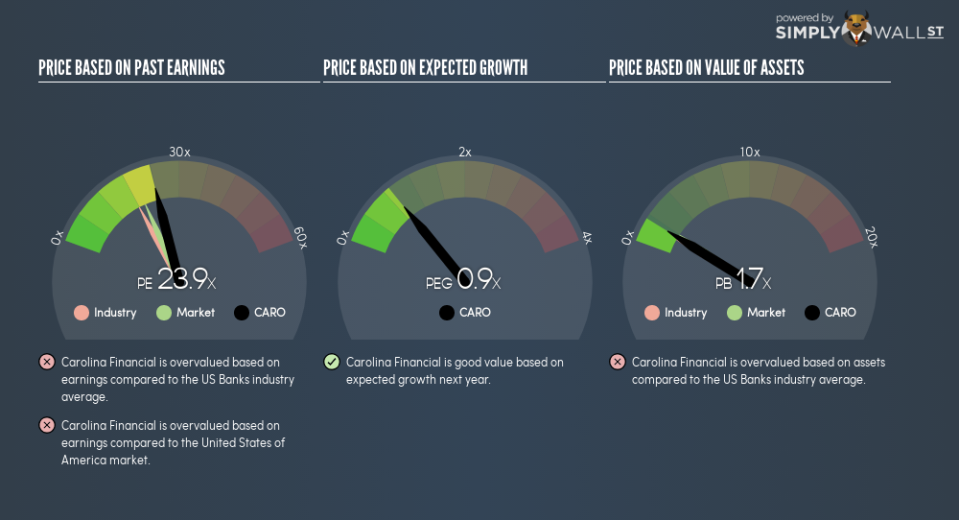
Carolina Financial Corporation (NASDAQ:CARO) is currently trading at a trailing P/E of 23.9, which is higher than the industry average of 17.9. While this might not seem positive, it is important to understand the assumptions behind the P/E ratio before you make any investment decisions. In this article, I will break down what the P/E ratio is, how to interpret it and what to watch out for.
See our latest analysis for Carolina Financial
Demystifying the P/E ratio
A common ratio used for relative valuation is the P/E ratio. By comparing a stock’s price per share to its earnings per share, we are able to see how much investors are paying for each dollar of the company’s earnings.
P/E Calculation for CARO
Price-Earnings Ratio = Price per share ÷ Earnings per share
CARO Price-Earnings Ratio = $41.19 ÷ $1.727 = 23.9x
The P/E ratio isn’t a metric you view in isolation and only becomes useful when you compare it against other similar companies. We preferably want to compare the stock’s P/E ratio to the average of companies that have similar features to CARO, such as capital structure and profitability. A quick method of creating a peer group is to use companies in the same industry, which is what I will do. At 23.9, CARO’s P/E is higher than its industry peers (17.9). This implies that investors are overvaluing each dollar of CARO’s earnings. This multiple is a median of profitable companies of 25 Banks companies in US including Great Basin Financial, Mercantil Servicios Financieros C.A and CIB Marine Bancshares. You could also say that the market is suggesting that CARO is a stronger business than the average comparable company.
Assumptions to watch out for
Before you jump to conclusions it is important to realise that there are assumptions in this analysis. Firstly, that our peer group contains companies that are similar to CARO. If this isn’t the case, the difference in P/E could be due to other factors. For example, Carolina Financial Corporation could be growing more quickly than the companies we’re comparing it with. In that case it would deserve a higher P/E ratio. We should also be aware that the stocks we are comparing to CARO may not be fairly valued. So while we can reasonably surmise that it is optimistically valued relative to a peer group, it might be fairly valued, if the peer group is undervalued.
What this means for you:
Since you may have already conducted your due diligence on CARO, the overvaluation of the stock may mean it is a good time to reduce your current holdings. But at the end of the day, keep in mind that relative valuation relies heavily on critical assumptions I’ve outlined above. Remember that basing your investment decision off one metric alone is certainly not sufficient. There are many things I have not taken into account in this article and the PE ratio is very one-dimensional. If you have not done so already, I urge you to complete your research by taking a look at the following:
Future Outlook: What are well-informed industry analysts predicting for CARO’s future growth? Take a look at our free research report of analyst consensus for CARO’s outlook.
Past Track Record: Has CARO been consistently performing well irrespective of the ups and downs in the market? Go into more detail in the past performance analysis and take a look at the free visual representations of CARO’s historicals for more clarity.
Other High-Performing Stocks: Are there other stocks that provide better prospects with proven track records? Explore our free list of these great stocks here.
To help readers see past the short term volatility of the financial market, we aim to bring you a long-term focused research analysis purely driven by fundamental data. Note that our analysis does not factor in the latest price-sensitive company announcements.
The author is an independent contributor and at the time of publication had no position in the stocks mentioned. For errors that warrant correction please contact the editor at editorial-team@simplywallst.com.
