Should You Be Tempted To Sell Creative Technology Ltd (SGX:C76) Because Of Its P/E Ratio?

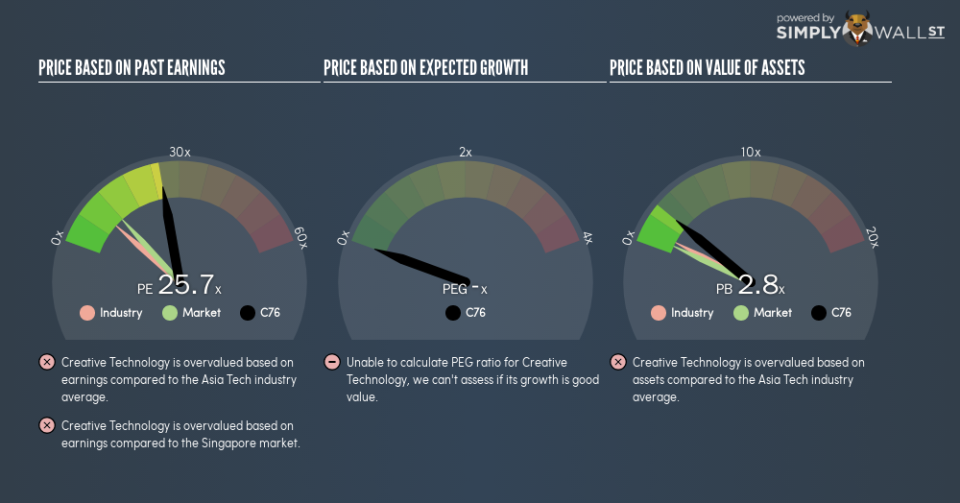
The goal of this article is to teach you how to use price to earnings ratios (P/E ratios). We’ll look at Creative Technology Ltd’s (SGX:C76) P/E ratio and reflect on what it tells us about the company’s share price. Based on the last twelve months, Creative Technology’s P/E ratio is 25.74. That is equivalent to an earnings yield of about 3.9%.
See our latest analysis for Creative Technology
How Do I Calculate A Price To Earnings Ratio?
The formula for price to earnings is:
Price to Earnings Ratio = Share Price (in reporting currency) ÷ Earnings per Share (EPS)
Or for Creative Technology:
P/E of 25.74 = $4.25 (Note: this is the share price in the reporting currency, namely, USD ) ÷ $0.17 (Based on the trailing twelve months to September 2018.)
Is A High Price-to-Earnings Ratio Good?
A higher P/E ratio means that investors are paying a higher price for each SGD1 of company earnings. That isn’t a good or a bad thing on its own, but a high P/E means that buyers have a higher opinion of the business’s prospects, relative to stocks with a lower P/E.
How Growth Rates Impact P/E Ratios
Probably the most important factor in determining what P/E a company trades on is the earnings growth. Earnings growth means that in the future the ‘E’ will be higher. That means unless the share price increases, the P/E will reduce in a few years. A lower P/E should indicate the stock is cheap relative to others — and that may attract buyers.
Notably, Creative Technology grew EPS by a whopping 91% in the last year. And it has bolstered its earnings per share by 41% per year over the last five years. With that performance, I would expect it to have an above average P/E ratio.
How Does Creative Technology’s P/E Ratio Compare To Its Peers?
The P/E ratio essentially measures market expectations of a company. You can see in the image below that the average P/E (9.3) for companies in the tech industry is lower than Creative Technology’s P/E.
Creative Technology’s P/E tells us that market participants think the company will perform better than its industry peers, going forward. Shareholders are clearly optimistic, but the future is always uncertain. So investors should delve deeper. I like to check if company insiders have been buying or selling.
Remember: P/E Ratios Don’t Consider The Balance Sheet
The ‘Price’ in P/E reflects the market capitalization of the company. That means it doesn’t take debt or cash into account. In theory, a company can lower its future P/E ratio by using cash or debt to invest in growth.
Such expenditure might be good or bad, in the long term, but the point here is that the balance sheet is not reflected by this ratio.
How Does Creative Technology’s Debt Impact Its P/E Ratio?
Creative Technology has net cash of US$108m. That should lead to a higher P/E than if it did have debt, because its strong balance sheets gives it more options.
The Verdict On Creative Technology’s P/E Ratio
Creative Technology’s P/E is 25.7 which is above average (11.9) in the SG market. Its net cash position supports a higher P/E ratio, as does its solid recent earnings growth. So it is not surprising the market is probably extrapolating recent growth well into the future, reflected in the relatively high P/E ratio.
When the market is wrong about a stock, it gives savvy investors an opportunity. If the reality for a company is better than it expects, you can make money by buying and holding for the long term. We don’t have analyst forecasts, but you might want to assess this data-rich visualization of earnings, revenue and cash flow.
You might be able to find a better buy than Creative Technology. If you want a selection of possible winners, check out this free list of interesting companies that trade on a P/E below 20 (but have proven they can grow earnings).
To help readers see past the short term volatility of the financial market, we aim to bring you a long-term focused research analysis purely driven by fundamental data. Note that our analysis does not factor in the latest price-sensitive company announcements.
The author is an independent contributor and at the time of publication had no position in the stocks mentioned. For errors that warrant correction please contact the editor at editorial-team@simplywallst.com.
