Should You Be Tempted To Sell Galp Energia, SGPS, S.A. (ELI:GALP) Because Of Its P/E Ratio?

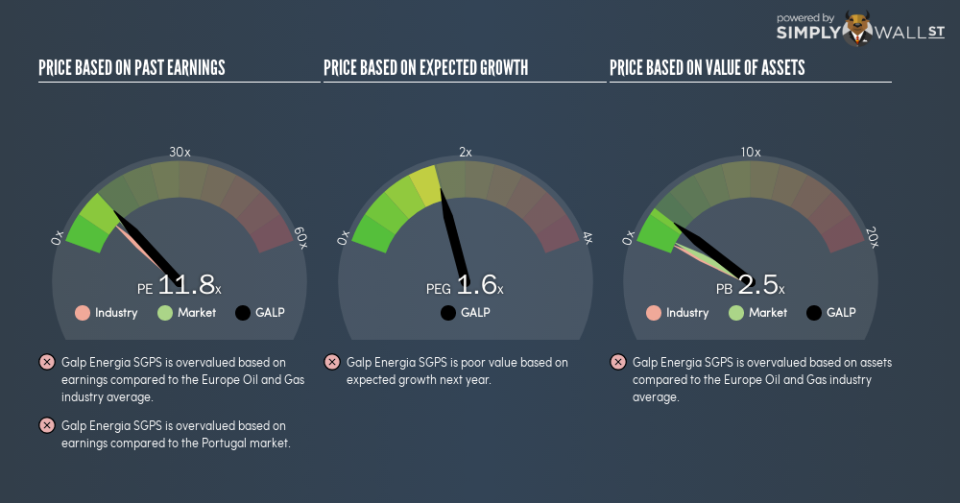
This article is written for those who want to get better at using price to earnings ratios (P/E ratios). We’ll show how you can use Galp Energia, SGPS, S.A.’s (ELI:GALP) P/E ratio to inform your assessment of the investment opportunity. Galp Energia SGPS has a price to earnings ratio of 11.76, based on the last twelve months. That is equivalent to an earnings yield of about 8.5%.
See our latest analysis for Galp Energia SGPS
How Do You Calculate Galp Energia SGPS’s P/E Ratio?
The formula for P/E is:
Price to Earnings Ratio = Share Price ÷ Earnings per Share (EPS)
Or for Galp Energia SGPS:
P/E of 11.76 = €13.46 ÷ €1.14 (Based on the year to September 2018.)
Is A High Price-to-Earnings Ratio Good?
A higher P/E ratio implies that investors pay a higher price for the earning power of the business. That isn’t a good or a bad thing on its own, but a high P/E means that buyers have a higher opinion of the business’s prospects, relative to stocks with a lower P/E.
How Growth Rates Impact P/E Ratios
P/E ratios primarily reflect market expectations around earnings growth rates. That’s because companies that grow earnings per share quickly will rapidly increase the ‘E’ in the equation. That means unless the share price increases, the P/E will reduce in a few years. So while a stock may look expensive based on past earnings, it could be cheap based on future earnings.
It’s nice to see that Galp Energia SGPS grew EPS by a stonking 113% in the last year. And it has bolstered its earnings per share by 50% per year over the last five years. So we’d generally expect it to have a relatively high P/E ratio.
How Does Galp Energia SGPS’s P/E Ratio Compare To Its Peers?
We can get an indication of market expectations by looking at the P/E ratio. The image below shows that Galp Energia SGPS has a higher P/E than the average (9.3) P/E for companies in the oil and gas industry.
That means that the market expects Galp Energia SGPS will outperform other companies in its industry. The market is optimistic about the future, but that doesn’t guarantee future growth. So further research is always essential. I often monitor director buying and selling.
A Limitation: P/E Ratios Ignore Debt and Cash In The Bank
The ‘Price’ in P/E reflects the market capitalization of the company. That means it doesn’t take debt or cash into account. Hypothetically, a company could reduce its future P/E ratio by spending its cash (or taking on debt) to achieve higher earnings.
Such spending might be good or bad, overall, but the key point here is that you need to look at debt to understand the P/E ratio in context.
How Does Galp Energia SGPS’s Debt Impact Its P/E Ratio?
Galp Energia SGPS has net debt worth 17% of its market capitalization. This could bring some additional risk, and reduce the number of investment options for management; worth remembering if you compare its P/E to businesses without debt.
The Verdict On Galp Energia SGPS’s P/E Ratio
Galp Energia SGPS’s P/E is 11.8 which is about average (11) in the PT market. Given it has reasonable debt levels, and grew earnings strongly last year, the P/E indicates the market has doubts this growth can be sustained.
When the market is wrong about a stock, it gives savvy investors an opportunity. As value investor Benjamin Graham famously said, ‘In the short run, the market is a voting machine but in the long run, it is a weighing machine.’ So this free visual report on analyst forecasts could hold they key to an excellent investment decision.
You might be able to find a better buy than Galp Energia SGPS. If you want a selection of possible winners, check out this free list of interesting companies that trade on a P/E below 20 (but have proven they can grow earnings).
To help readers see past the short term volatility of the financial market, we aim to bring you a long-term focused research analysis purely driven by fundamental data. Note that our analysis does not factor in the latest price-sensitive company announcements.
The author is an independent contributor and at the time of publication had no position in the stocks mentioned. For errors that warrant correction please contact the editor at editorial-team@simplywallst.com.
