Should You Be Tempted To Sell Kamux Oyj (HEL:KAMUX) Because Of Its P/E Ratio?

The goal of this article is to teach you how to use price to earnings ratios (P/E ratios). We'll look at Kamux Oyj's (HEL:KAMUX) P/E ratio and reflect on what it tells us about the company's share price. What is Kamux Oyj's P/E ratio? Well, based on the last twelve months it is 19.53. In other words, at today's prices, investors are paying €19.53 for every €1 in prior year profit.
Check out our latest analysis for Kamux Oyj
How Do You Calculate A P/E Ratio?
The formula for price to earnings is:
Price to Earnings Ratio = Price per Share ÷ Earnings per Share (EPS)
Or for Kamux Oyj:
P/E of 19.53 = EUR8.64 ÷ EUR0.44 (Based on the trailing twelve months to September 2019.)
Is A High P/E Ratio Good?
A higher P/E ratio means that buyers have to pay a higher price for each EUR1 the company has earned over the last year. That is not a good or a bad thing per se, but a high P/E does imply buyers are optimistic about the future.
Does Kamux Oyj Have A Relatively High Or Low P/E For Its Industry?
One good way to get a quick read on what market participants expect of a company is to look at its P/E ratio. You can see in the image below that the average P/E (15.1) for companies in the specialty retail industry is lower than Kamux Oyj's P/E.
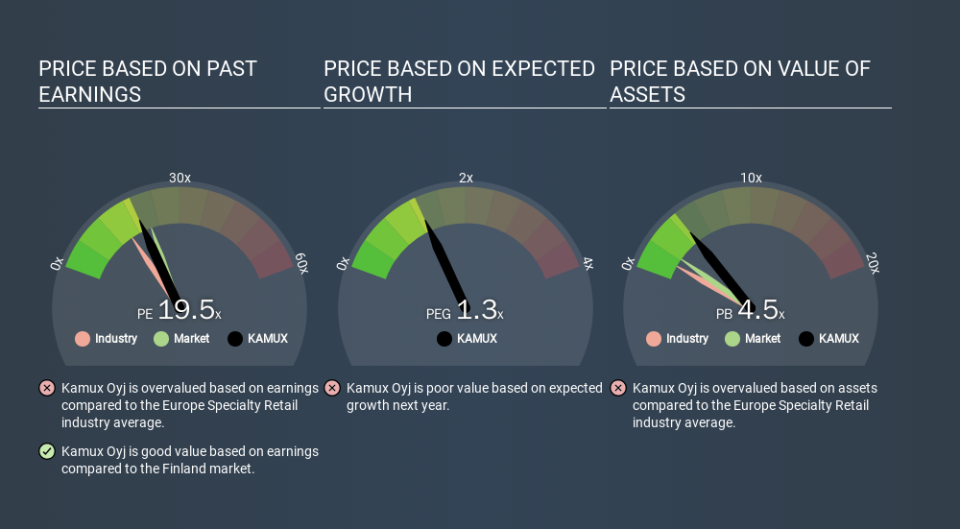
Its relatively high P/E ratio indicates that Kamux Oyj shareholders think it will perform better than other companies in its industry classification. Shareholders are clearly optimistic, but the future is always uncertain. So further research is always essential. I often monitor director buying and selling.
How Growth Rates Impact P/E Ratios
Generally speaking the rate of earnings growth has a profound impact on a company's P/E multiple. If earnings are growing quickly, then the 'E' in the equation will increase faster than it would otherwise. That means unless the share price increases, the P/E will reduce in a few years. Then, a lower P/E should attract more buyers, pushing the share price up.
Kamux Oyj increased earnings per share by a whopping 33% last year. And earnings per share have improved by 20% annually, over the last five years. So we'd generally expect it to have a relatively high P/E ratio.
Remember: P/E Ratios Don't Consider The Balance Sheet
The 'Price' in P/E reflects the market capitalization of the company. So it won't reflect the advantage of cash, or disadvantage of debt. Hypothetically, a company could reduce its future P/E ratio by spending its cash (or taking on debt) to achieve higher earnings.
Such expenditure might be good or bad, in the long term, but the point here is that the balance sheet is not reflected by this ratio.
Is Debt Impacting Kamux Oyj's P/E?
Net debt totals just 0.09% of Kamux Oyj's market cap. It would probably trade on a higher P/E ratio if it had a lot of cash, but I doubt it is having a big impact.
The Bottom Line On Kamux Oyj's P/E Ratio
Kamux Oyj trades on a P/E ratio of 19.5, which is below the FI market average of 22.3. The company does have a little debt, and EPS growth was good last year. If the company can continue to grow earnings, then the current P/E may be unjustifiably low. Because analysts are predicting more growth in the future, one might have expected to see a higher P/E ratio. You can take a closer look at the fundamentals, here.
Investors should be looking to buy stocks that the market is wrong about. If the reality for a company is not as bad as the P/E ratio indicates, then the share price should increase as the market realizes this. So this free visualization of the analyst consensus on future earnings could help you make the right decision about whether to buy, sell, or hold.
Of course, you might find a fantastic investment by looking at a few good candidates. So take a peek at this free list of companies with modest (or no) debt, trading on a P/E below 20.
If you spot an error that warrants correction, please contact the editor at editorial-team@simplywallst.com. This article by Simply Wall St is general in nature. It does not constitute a recommendation to buy or sell any stock, and does not take account of your objectives, or your financial situation. Simply Wall St has no position in the stocks mentioned.
We aim to bring you long-term focused research analysis driven by fundamental data. Note that our analysis may not factor in the latest price-sensitive company announcements or qualitative material. Thank you for reading.
