Should You Be Tempted To Sell Marathon Petroleum Corporation (NYSE:MPC) Because Of Its P/E Ratio?

This article is written for those who want to get better at using price to earnings ratios (P/E ratios). We'll look at Marathon Petroleum Corporation's (NYSE:MPC) P/E ratio and reflect on what it tells us about the company's share price. Looking at earnings over the last twelve months, Marathon Petroleum has a P/E ratio of 11.96. That corresponds to an earnings yield of approximately 8.4%.
Check out our latest analysis for Marathon Petroleum
How Do I Calculate Marathon Petroleum's Price To Earnings Ratio?
The formula for price to earnings is:
Price to Earnings Ratio = Price per Share ÷ Earnings per Share (EPS)
Or for Marathon Petroleum:
P/E of 11.96 = $53.92 ÷ $4.51 (Based on the year to June 2019.)
Is A High Price-to-Earnings Ratio Good?
The higher the P/E ratio, the higher the price tag of a business, relative to its trailing earnings. All else being equal, it's better to pay a low price -- but as Warren Buffett said, 'It's far better to buy a wonderful company at a fair price than a fair company at a wonderful price.
Does Marathon Petroleum Have A Relatively High Or Low P/E For Its Industry?
We can get an indication of market expectations by looking at the P/E ratio. As you can see below, Marathon Petroleum has a higher P/E than the average company (10.1) in the oil and gas industry.
Marathon Petroleum's P/E tells us that market participants think the company will perform better than its industry peers, going forward. The market is optimistic about the future, but that doesn't guarantee future growth. So further research is always essential. I often monitor director buying and selling.
How Growth Rates Impact P/E Ratios
Generally speaking the rate of earnings growth has a profound impact on a company's P/E multiple. That's because companies that grow earnings per share quickly will rapidly increase the 'E' in the equation. Therefore, even if you pay a high multiple of earnings now, that multiple will become lower in the future. So while a stock may look expensive based on past earnings, it could be cheap based on future earnings.
Marathon Petroleum's earnings per share fell by 46% in the last twelve months. But it has grown its earnings per share by 7.7% per year over the last five years.
A Limitation: P/E Ratios Ignore Debt and Cash In The Bank
Don't forget that the P/E ratio considers market capitalization. That means it doesn't take debt or cash into account. Theoretically, a business can improve its earnings (and produce a lower P/E in the future) by investing in growth. That means taking on debt (or spending its cash).
Such spending might be good or bad, overall, but the key point here is that you need to look at debt to understand the P/E ratio in context.
So What Does Marathon Petroleum's Balance Sheet Tell Us?
Marathon Petroleum's net debt is 75% of its market cap. This is enough debt that you'd have to make some adjustments before using the P/E ratio to compare it to a company with net cash.
The Bottom Line On Marathon Petroleum's P/E Ratio
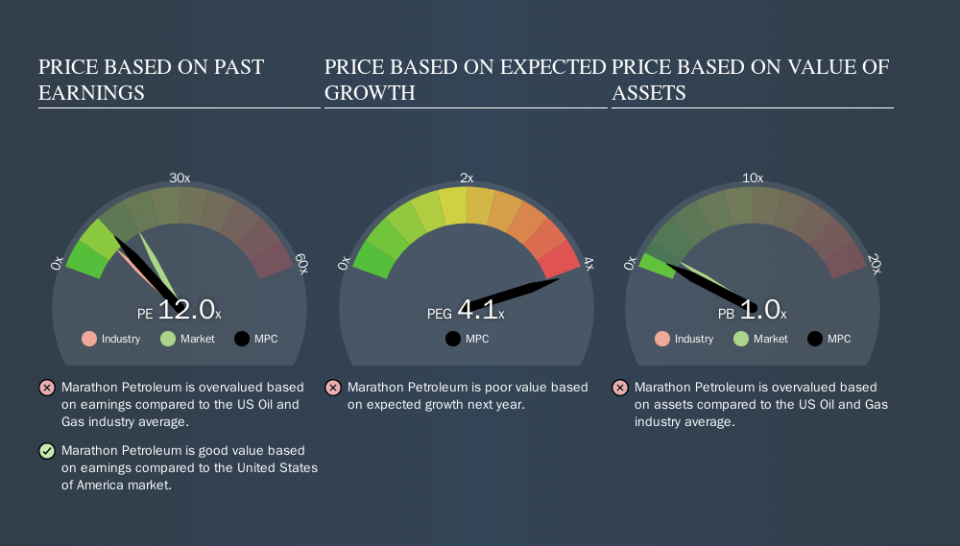
Marathon Petroleum's P/E is 12.0 which is below average (18.0) in the US market. When you consider that the company has significant debt, and didn't grow EPS last year, it isn't surprising that the market has muted expectations.
Investors have an opportunity when market expectations about a stock are wrong. If it is underestimating a company, investors can make money by buying and holding the shares until the market corrects itself. So this free visual report on analyst forecasts could hold the key to an excellent investment decision.
But note: Marathon Petroleum may not be the best stock to buy. So take a peek at this free list of interesting companies with strong recent earnings growth (and a P/E ratio below 20).
We aim to bring you long-term focused research analysis driven by fundamental data. Note that our analysis may not factor in the latest price-sensitive company announcements or qualitative material.
If you spot an error that warrants correction, please contact the editor at editorial-team@simplywallst.com. This article by Simply Wall St is general in nature. It does not constitute a recommendation to buy or sell any stock, and does not take account of your objectives, or your financial situation. Simply Wall St has no position in the stocks mentioned. Thank you for reading.
