Should You Be Tempted To Sell MicroStrategy Incorporated (NASDAQ:MSTR) Because Of Its P/E Ratio?

Want to participate in a short research study? Help shape the future of investing tools and receive a $20 prize!
This article is for investors who would like to improve their understanding of price to earnings ratios (P/E ratios). We’ll show how you can use MicroStrategy Incorporated’s (NASDAQ:MSTR) P/E ratio to inform your assessment of the investment opportunity. Based on the last twelve months, MicroStrategy’s P/E ratio is 72.36. In other words, at today’s prices, investors are paying $72.36 for every $1 in prior year profit.
Check out our latest analysis for MicroStrategy
How Do You Calculate A P/E Ratio?
The formula for P/E is:
Price to Earnings Ratio = Share Price ÷ Earnings per Share (EPS)
Or for MicroStrategy:
P/E of 72.36 = $143.13 ÷ $1.98 (Based on the trailing twelve months to December 2018.)
Is A High Price-to-Earnings Ratio Good?
A higher P/E ratio implies that investors pay a higher price for the earning power of the business. That isn’t necessarily good or bad, but a high P/E implies relatively high expectations of what a company can achieve in the future.
How Growth Rates Impact P/E Ratios
If earnings fall then in the future the ‘E’ will be lower. That means even if the current P/E is low, it will increase over time if the share price stays flat. So while a stock may look cheap based on past earnings, it could be expensive based on future earnings.
Notably, MicroStrategy grew EPS by a whopping 28% in the last year. But earnings per share are down 1.1% per year over the last five years.
How Does MicroStrategy’s P/E Ratio Compare To Its Peers?
The P/E ratio essentially measures market expectations of a company. The image below shows that MicroStrategy has a higher P/E than the average (49.8) P/E for companies in the software industry.
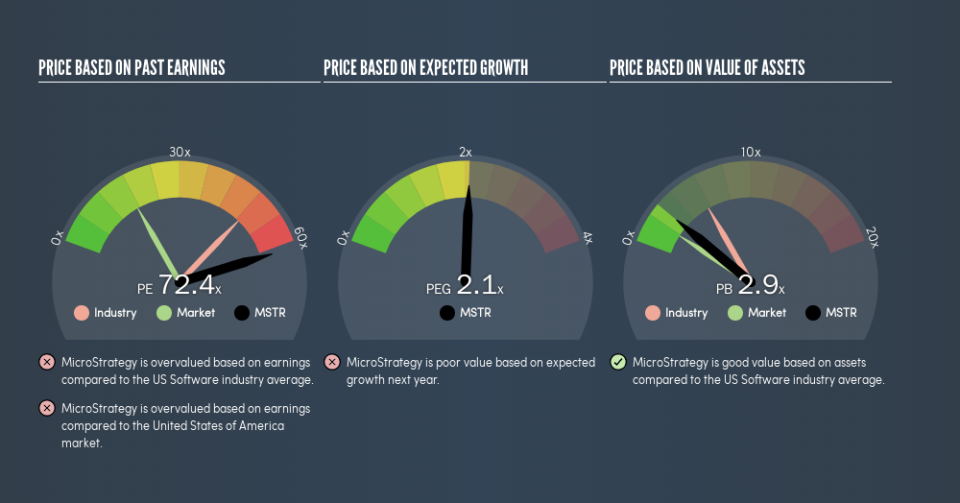
MicroStrategy’s P/E tells us that market participants think the company will perform better than its industry peers, going forward. Shareholders are clearly optimistic, but the future is always uncertain. So investors should delve deeper. I like to check if company insiders have been buying or selling.
Remember: P/E Ratios Don’t Consider The Balance Sheet
It’s important to note that the P/E ratio considers the market capitalization, not the enterprise value. In other words, it does not consider any debt or cash that the company may have on the balance sheet. In theory, a company can lower its future P/E ratio by using cash or debt to invest in growth.
Such spending might be good or bad, overall, but the key point here is that you need to look at debt to understand the P/E ratio in context.
MicroStrategy’s Balance Sheet
MicroStrategy has net cash of US$576m. That should lead to a higher P/E than if it did have debt, because its strong balance sheets gives it more options.
The Verdict On MicroStrategy’s P/E Ratio
MicroStrategy trades on a P/E ratio of 72.4, which is multiples above the US market average of 17.5. Its strong balance sheet gives the company plenty of resources for extra growth, and it has already proven it can grow. So it does not seem strange that the P/E is above average.
When the market is wrong about a stock, it gives savvy investors an opportunity. As value investor Benjamin Graham famously said, ‘In the short run, the market is a voting machine but in the long run, it is a weighing machine.’ So this free visual report on analyst forecasts could hold the key to an excellent investment decision.
You might be able to find a better buy than MicroStrategy. If you want a selection of possible winners, check out this free list of interesting companies that trade on a P/E below 20 (but have proven they can grow earnings).
We aim to bring you long-term focused research analysis driven by fundamental data. Note that our analysis may not factor in the latest price-sensitive company announcements or qualitative material.
If you spot an error that warrants correction, please contact the editor at editorial-team@simplywallst.com. This article by Simply Wall St is general in nature. It does not constitute a recommendation to buy or sell any stock, and does not take account of your objectives, or your financial situation. Simply Wall St has no position in the stocks mentioned. Thank you for reading.
