Should You Be Tempted To Sell Pinnacle Financial Partners Inc (NASDAQ:PNFP) At Its Current PE Ratio?

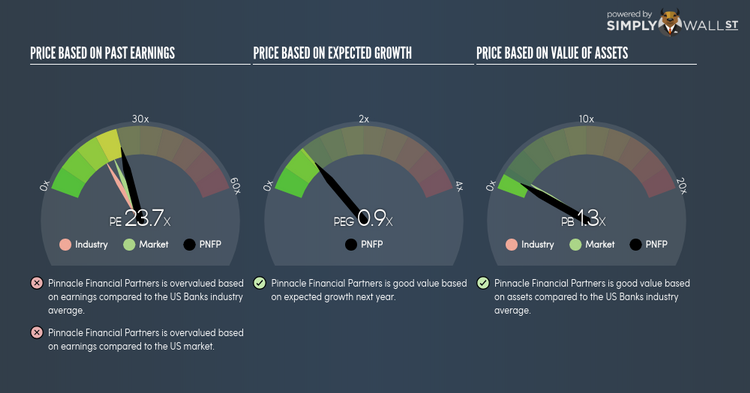
Pinnacle Financial Partners Inc (NASDAQ:PNFP) is trading with a trailing P/E of 23.7x, which is higher than the industry average of 17x. While this makes PNFP appear like a stock to avoid or sell if you own it, you might change your mind after I explain the assumptions behind the P/E ratio. In this article, I will break down what the P/E ratio is, how to interpret it and what to watch out for. View our latest analysis for Pinnacle Financial Partners
Demystifying the P/E ratio
P/E is a popular ratio used for relative valuation. By comparing a stock’s price per share to its earnings per share, we are able to see how much investors are paying for each dollar of the company’s earnings.
P/E Calculation for PNFP
Price-Earnings Ratio = Price per share ÷ Earnings per share
PNFP Price-Earnings Ratio = $64.65 ÷ $2.729 = 23.7x
On its own, the P/E ratio doesn’t tell you much; however, it becomes extremely useful when you compare it with other similar companies. We want to compare the stock’s P/E ratio to the average of companies that have similar characteristics as PNFP, such as size and country of operation. A quick method of creating a peer group is to use companies in the same industry, which is what I will do. At 23.7x, PNFP’s P/E is higher than its industry peers (17x). This implies that investors are overvaluing each dollar of PNFP’s earnings. Therefore, according to this analysis, PNFP is an over-priced stock.
Assumptions to watch out for
Before you jump to the conclusion that PNFP should be banished from your portfolio, it is important to realise that our conclusion rests on two assertions. The first is that our “similar companies” are actually similar to PNFP, or else the difference in P/E might be a result of other factors. For example, if you are comparing lower risk firms with PNFP, then its P/E would naturally be lower than its peers, as investors would value those with lower risk at a higher price. The second assumption that must hold true is that the stocks we are comparing PNFP to are fairly valued by the market. If this is violated, PNFP’s P/E may be lower than its peers as they are actually overvalued by investors.
To help readers see pass the short term volatility of the financial market, we aim to bring you a long-term focused research analysis purely driven by fundamental data. Note that our analysis does not factor in the latest price sensitive company announcements.
The author is an independent contributor and at the time of publication had no position in the stocks mentioned.
