Should You Be Tempted To Sell Tritax Big Box REIT plc (LON:BBOX) Because Of Its PE Ratio?

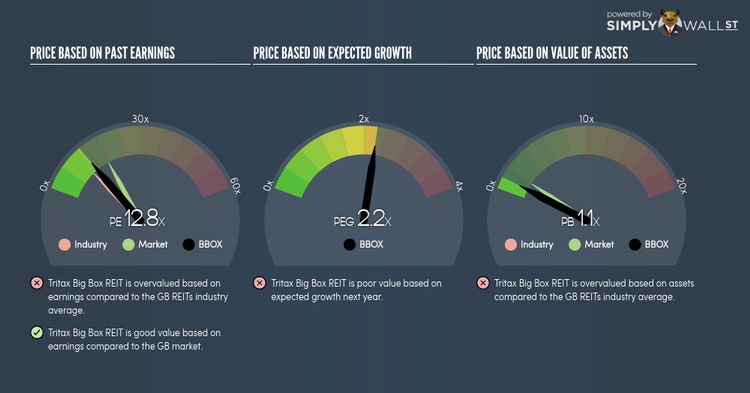
Tritax Big Box REIT plc (LSE:BBOX) is currently trading at a trailing P/E of 12.8x, which is higher than the industry average of 10.9x. While this makes BBOX appear like a stock to avoid or sell if you own it, you might change your mind after I explain the assumptions behind the P/E ratio. Today, I will deconstruct the P/E ratio and highlight what you need to be careful of when using the P/E ratio. View our latest analysis for Tritax Big Box REIT
Breaking down the Price-Earnings ratio
The P/E ratio is a popular ratio used in relative valuation since earnings power is a key driver of investment value. By comparing a stock’s price per share to its earnings per share, we are able to see how much investors are paying for each pound of the company’s earnings.
P/E Calculation for BBOX
Price-Earnings Ratio = Price per share ÷ Earnings per share
BBOX Price-Earnings Ratio = £1.43 ÷ £0.112 = 12.8x
The P/E ratio isn’t a metric you view in isolation and only becomes useful when you compare it against other similar companies. We want to compare the stock’s P/E ratio to the average of companies that have similar characteristics as BBOX, such as size and country of operation. One way of gathering a peer group is to use firms in the same industry, which is what I’ll do. Since BBOX’s P/E of 12.8x is higher than its industry peers (10.9x), it means that investors are paying more than they should for each dollar of BBOX’s earnings. As such, our analysis shows that BBOX represents an over-priced stock.
Assumptions to be aware of
While our conclusion might prompt you to sell your BBOX shares immediately, there are two important assumptions you should be aware of. The first is that our “similar companies” are actually similar to BBOX, or else the difference in P/E might be a result of other factors. For example, if you are comparing lower risk firms with BBOX, then its P/E would naturally be lower than its peers, as investors would value those with lower risk at a higher price. The second assumption that must hold true is that the stocks we are comparing BBOX to are fairly valued by the market. If this does not hold, there is a possibility that BBOX’s P/E is lower because our peer group is overvalued by the market.
To help readers see pass the short term volatility of the financial market, we aim to bring you a long-term focused research analysis purely driven by fundamental data. Note that our analysis does not factor in the latest price sensitive company announcements.
The author is an independent contributor and at the time of publication had no position in the stocks mentioned.
