Texas new homes selling at a record pace, prices spike
HomesUSA.com reports “inventory squeeze” lowers Days on Market, fewer active listings, and auction-style sales anticipated
Ben Caballero, founder and CEO, HomesUSA.com

Ben Caballero, founder and CEO of HomesUSA.com, is the current Guinness World Record title holder for “Most annual home sale transactions through MLS by an individual sell side real estate agent.”
Chart 1: Texas New Homes: Days on Market - March 2021

The 12-month moving average for Days on Market dropped from 100 days to 86.54 days in the last six months, with the three-month average at 76.54 days, according to the HomesUSA.com News Home Sales Index.
Chart 2: Texas New Home Sales - March 2021

While the 12-month moving average for March shows Texas new home sales increased slightly to 4,556 sales from 4,544 sales in February, the 3-month moving average shows the impact of tightening inventory. According to the HomesUSA.com report, the index tracking the 3-month moving average shows a significant drop in total monthly new home sales statewide, with March showing 3,753 sales versus 3,901 in February.
Chart 3: Texas New Home Prices - March 2021
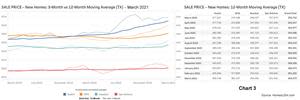
Statewide the 12-month moving average of new home prices rose in March to $364,573 versus $361,320 in February. A moving average increase of more than $3,000 in a single month was the highest single month price increase in the last 12 months.
Chart 4: Sales-to-List-Price Ratio Data for Texas New Homes - March 2021

New home sales continue to sell closer to their asking price. March’s 12-month moving average of the sales-to-list price ratio statewide was 98.422 percent versus 98.363 percent in February.
Chart 5: Texas Pending New Homes Sales - March 2021

The 12-month moving average of pending sales increased in March with 5,643 versus 5,524 in February.
Chart 6: Active Listings for New Home Sales - March 2021

As demand continues to rapidly outpace supply, builders’ inventory decreased significantly. Looking at the 3-month moving average, active listings fell sharply statewide in March to 16,055 versus 17,503 in February. The 12-month moving average fell in March to 19,842 versus 20,641 in February.
Chart 7: Texas 3-Month Moving Averages – New Homes - March 2021
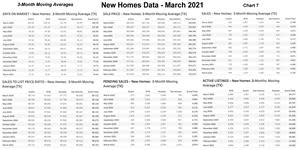
The monthly HomesUSA.com report includes 3-month moving averages for all essential market data, including Days on Market, sales volume, sales prices, a sales-to-list price ratio, pending sales, and active listings. The 3-month indices track market seasonality while the 12-month moving average removes the seasonality and tracks the longer trend.
DALLAS, April 20, 2021 (GLOBE NEWSWIRE) -- Texas home builders are facing extraordinary demand for new homes, which are selling at a record pace and causing prices to jump, HomesUSA.com reported today. The 12-month moving average for Days on Market dropped from 100 days to 86.54 days in the last six months, with the three-month average at 76.54 days, according to the HomesUSA.com News Home Sales Index. It’s the fastest sales pace of new homes since HomesUSA.com started reporting Days on Market data in 2017.
The HomesUSA.com report is based on data from the North Texas Real Estate Information Systems, Houston Association of REALTORS, Austin Board of REALTORS Multiple Listing Services and San Antonio Board of REALTORS.
"I expect to see some Texas builders using auctions to sell new homes as the demand shows no signs of slowing," said Ben Caballero, owner of HomesUSA.com and current Guinness World Record titleholder.
Caballero, who has personally sold more new homes than any other real estate agent in history, added, "With so many companies relocating to Texas, and more millennials beginning to buy homes, the demand is going to continue creating an inventory squeeze and buyers can expect higher prices." Caballero points out that because new homes are listed during construction, they carry an average DOM of approximately 60 days higher than existing homes.
Caballero noted that statewide, the 12-month moving average of new home prices rose in March to $364,573 versus $361,320 in February. A moving average increase of more than $3,000 in a single month was the highest single month price increase in the last 12 months. The average price of new homes was higher in all four of Texas’ largest new home markets, including Dallas-Ft. Worth, Houston, Austin and San Antonio.
While the 12-month moving average for March shows Texas new home sales increased slightly to 4,556 sales from 4,544 sales in February, the 3-month moving average shows the impact of tightening inventory. According to the HomesUSA.com report, the index tracking the 3-month moving average shows a significant drop in total monthly new home sales statewide, with March showing 3,753 sales versus 3,901 in February.
The 12-month moving average of pending sales increased in March with 5,643 versus 5,524 in February. More insight into declining inventory comes from March’s statewide active listings, with the 12-month moving average falling, with March registering 19,842 versus 20,641 in February.
Caballero is sharing the HomesUSA.com New Homes Report in advance of the release by the Commerce Department of its nationwide New Residential Sales report for March set for Friday, April 23, at 10:00 am Eastern.
Caballero noted the monthly HomesUSA.com report includes 3-month moving averages for all essential market data, including Days on Market, sales volume, sales prices, a sales-to-list price ratio, pending sales, and active listings. The 3-month indices track market seasonality while the 12-month moving average removes the seasonality and tracks the longer trend.
Days on Market – New Homes in Texas (Exclusive Data)
The HomesUSA.com New Home Sales Index showed the 12-month moving average of Days on Market dropped in all four major markets: Dallas-Ft. Worth, Houston, Austin, and San Antonio. The DOM for Dallas-Ft. Worth was 81.31 days in March versus 84.03 days in February. In Houston, the DOM was 98.92 days in March versus 101.27 days in February. Austin's DOM was 73.52 days in March versus 77.75 days in February. In San Antonio, the DOM was 83.62 days in March versus 85.86 days in February. (See Chart 1: Texas New Homes Days on Market)
Texas New Home Sales Data
Total new home sales for last month were slightly higher statewide in Texas, but split within its major new home markets, according to the 12-month moving averages. Houston posted higher March sales totaling 1,570 versus 1,549 in February, as did San Antonio, with March sales totaling to 689 versus 672 in February. In Dallas-Ft. Worth, March sales were lower, totaling 1,570 versus 1,583 in February. Austin’s March sales also were down, totaling 728 versus 741 in February. (See Chart 2: Texas New Home Sales)
Texas New Home Prices
The average price of new homes was higher statewide in all four major new home markets in Texas. Dallas-Ft. Worth reported its 12-month moving average price for new homes was $381,537 in March versus $377,899 in February. In Houston, the average new home price was $354,492 in March versus $350,031 in February. Austin's average price was $409,748 in March versus $405,906 in February. In San Antonio, the average new home price was $301,442 in March versus $299,845 in February. (See Chart 3: Texas New Home Prices)
Texas Sales-to-List Price Ratio
New home sales continue to sell closer to their asking price. March’s 12-month moving average of the sales-to-list price ratio statewide was 98.422 percent versus 98.363 percent in February. In Dallas-Ft. Worth, it was 98.390 percent in March versus 98.306 percent in February. In Houston, it was 98.115 percent in March versus 98.054 percent in February. The Austin ratio was 99.189 percent in March versus 98.098 percent in February, and San Antonio's ratio was 98.402 percent last month versus 98.410 percent in February. (See Chart 4: Texas Sales-to-List Price Ratio)
Texas Pending New Homes Sales Data
New home sale activity in Houston, Dallas-Ft. Worth and San Antonio pushed the 12-month moving average for pending new home sales higher in March. Austin was the one market where pending sales declined. Dallas-Ft. Worth pending sales were up last month at 2,015 vs 1,989 in February. Houston’s March pending sales were up at 1,992 versus 1,907 in February. In San Antonio, pending sales were 921 last month versus 896 in February. Austin reported pending sales in March of 715 versus 732 in February. (See Chart 5: Texas Pending New Home Sales)
Texas Active Listings for New Homes
As demand continues to rapidly outpace supply, builders’ inventory decreased significantly. Looking at the 3-month moving average, active listings fell sharply statewide in March to 16,055 versus 17,503 in February.
The 12-month moving average for active listings in Dallas-Ft. Worth dropped in March from 6,119 versus 6,334 in February. In Houston, last month’s active listings were 7,867 versus 8,011 in February. In Austin, March was 2,684 versus 2,927 in February. San Antonio reported 3,172 active new home listings last month versus 3,370 in February. (See Chart 6: Texas Pending New Home Sales and Chart 7: 3-Month Moving Averages)
About the HomesUSA.com New Home Sales Index
The HomesUSA.com Index is a 12-month moving average of the Days on Market (DOM) for new homes listed in the local Multiple Listing Services (MLSs) for the four largest Texas markets, including Dallas-Ft. Worth, Houston, Austin, and San Antonio. Created by Ben Caballero, founder and CEO of HomesUSA.com, it is the first Days on Market index to track Texas's new home market.
About Ben Caballero and HomesUSA.com®
Ben Caballero, founder and CEO of HomesUSA.com, holds the current Guinness World Record title for “Most annual home sale transactions through MLS by an individual sell side real estate agent.” Ranked by REAL Trends as America’s top real estate agent for home sales since 2013, Ben is the most productive real estate agent in U.S. history. He is the only agent to exceed $1 billion in residential sales transactions in a single year, a feat first achieved in 2015 and repeated each year through 2018, when he achieved more than $2 billion. An award-winning innovator and technology pioneer, Ben works with more than 60 home builders in Dallas-Fort Worth, Houston, Austin, and San Antonio. His podcast series is available on iTunes and Google Podcasts. An infographic illustrating Ben’s sales production is here. Learn more at HomesUSA.com |Twitter: @bcaballero - @HomesUSA | Facebook: /HomesUSAdotcom.
Note for journalists: You may contact Ben Caballero directly on his cell at (214) 616-9222 or by email at ben@homesusa.com.
"REALTOR® is a federally registered collective membership mark which identifies a real estate professional who is member of the NATIONAL ASSOCIATION OF REALTORS® and subscribes to its strict Code of Ethics."
Media Contact:
Kevin Hawkins
(206) 866-1220
kevin@wavgroup.com
Image: Ben Caballero
https://www.homesusa.com/wp-content/uploads/2018/09/Ben-Caballero-Portrait-Grey-4288x2848.jpg
Individual Chart images:
Chart 1: Texas New Homes Tracking - Days on Market – March 2021: https://homesusa.com/wp-content/uploads/2021/04/Chart-1-Texas-Days-on-Market.jpg
Chart 2: Texas New Home Sales – March 2021: https://homesusa.com/wp-content/uploads/2021/04/Chart-2-Texas-New-Home-Sales.jpg
Chart 3: Texas New Home Sales Prices – March 2021: https://homesusa.com/wp-content/uploads/2021/04/Chart-3-Texas-New-Home-Sales-Prices.jpg
Chart 4: Texas Sales-to-List-Price Ratio – March 2021: https://homesusa.com/wp-content/uploads/2021/04/Chart-4-Texas-Sales-to-List-Price-Ratio.jpg
Chart 5: Texas Pending New Home Sales – March 2021: https://homesusa.com/wp-content/uploads/2021/04/Chart-5-Texas-Pending-New-Home-Sales.jpg
Chart 6: Texas Active Listings for New Homes – March 2021: https://homesusa.com/wp-content/uploads/2021/04/Chart-6-Texas-Active-Listings.jpg
Chart 7: Texas 3-Month Rolling Averages – New Homes – March 2021: https://homesusa.com/wp-content/uploads/2021/04/Chart-7-3MonthChart-DataOnly.jpg
