Those who invested in Ellington Financial (NYSE:EFC) three years ago are up 18%
For many investors, the main point of stock picking is to generate higher returns than the overall market. But if you try your hand at stock picking, your risk returning less than the market. We regret to report that long term Ellington Financial Inc. (NYSE:EFC) shareholders have had that experience, with the share price dropping 12% in three years, versus a market return of about 46%. Unfortunately the share price momentum is still quite negative, with prices down 9.9% in thirty days. But this could be related to poor market conditions -- stocks are down 9.5% in the same time.
Since shareholders are down over the longer term, lets look at the underlying fundamentals over the that time and see if they've been consistent with returns.
Check out our latest analysis for Ellington Financial
While the efficient markets hypothesis continues to be taught by some, it has been proven that markets are over-reactive dynamic systems, and investors are not always rational. One way to examine how market sentiment has changed over time is to look at the interaction between a company's share price and its earnings per share (EPS).
Although the share price is down over three years, Ellington Financial actually managed to grow EPS by 12% per year in that time. Given the share price reaction, one might suspect that EPS is not a good guide to the business performance during the period (perhaps due to a one-off loss or gain). Or else the company was over-hyped in the past, and so its growth has disappointed.
We're actually a quite surprised to see the share price down while EPS have grown strongly. Therefore, we should look at some other metrics to try to understand why the market is disappointed.
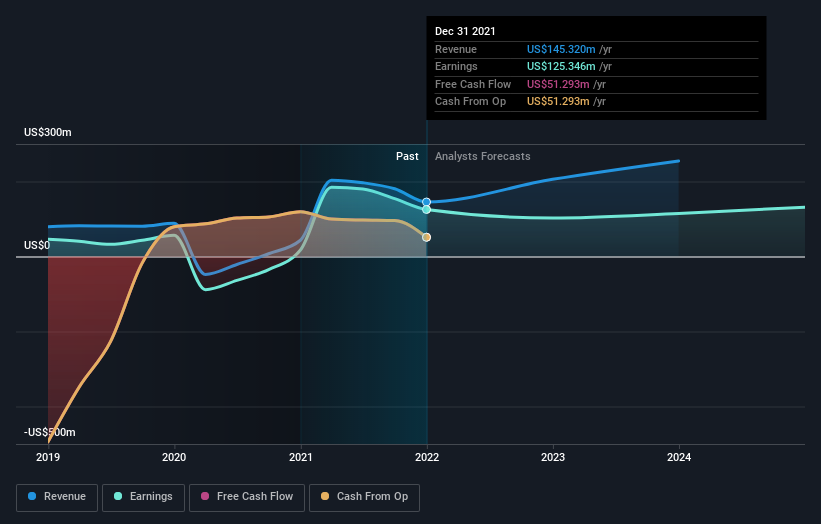
Given the healthiness of the dividend payments, we doubt that they've concerned the market. It's good to see that Ellington Financial has increased its revenue over the last three years. But it's not clear to us why the share price is down. It might be worth diving deeper into the fundamentals, lest an opportunity goes begging.
The graphic below depicts how earnings and revenue have changed over time (unveil the exact values by clicking on the image).
We know that Ellington Financial has improved its bottom line lately, but what does the future have in store? So we recommend checking out this free report showing consensus forecasts
What About Dividends?
It is important to consider the total shareholder return, as well as the share price return, for any given stock. The TSR incorporates the value of any spin-offs or discounted capital raisings, along with any dividends, based on the assumption that the dividends are reinvested. So for companies that pay a generous dividend, the TSR is often a lot higher than the share price return. We note that for Ellington Financial the TSR over the last 3 years was 18%, which is better than the share price return mentioned above. This is largely a result of its dividend payments!
A Different Perspective
While it's never nice to take a loss, Ellington Financial shareholders can take comfort that , including dividends,their trailing twelve month loss of 1.5% wasn't as bad as the market loss of around 6.9%. Longer term investors wouldn't be so upset, since they would have made 10%, each year, over five years. In the best case scenario the last year is just a temporary blip on the journey to a brighter future. I find it very interesting to look at share price over the long term as a proxy for business performance. But to truly gain insight, we need to consider other information, too. To that end, you should learn about the 4 warning signs we've spotted with Ellington Financial (including 2 which are a bit concerning) .
If you like to buy stocks alongside management, then you might just love this free list of companies. (Hint: insiders have been buying them).
Please note, the market returns quoted in this article reflect the market weighted average returns of stocks that currently trade on US exchanges.
Have feedback on this article? Concerned about the content? Get in touch with us directly. Alternatively, email editorial-team (at) simplywallst.com.
This article by Simply Wall St is general in nature. We provide commentary based on historical data and analyst forecasts only using an unbiased methodology and our articles are not intended to be financial advice. It does not constitute a recommendation to buy or sell any stock, and does not take account of your objectives, or your financial situation. We aim to bring you long-term focused analysis driven by fundamental data. Note that our analysis may not factor in the latest price-sensitive company announcements or qualitative material. Simply Wall St has no position in any stocks mentioned.
