Three Understated Metrics For Preferred Bank (NASDAQ:PFBC) You Should Know

As a small-cap bank stock with a market capitalisation of USD $974.72M, Preferred Bank’s (NASDAQ:PFBC) risk and profitability are largely determined by the underlying economic growth of the US regions in which it operates. A bank’s cash flow is directly impacted by economic growth as it is the main driver of deposit levels and demand for loans which it profits from. After the Financial Crisis in 2008, a set of reforms called Basel III was created with the purpose of strengthening regulation, risk management and supervision in the banking sector. The Basel III reforms are aimed at banking regulations to improve financial institutions’ ability to absorb shocks caused by economic stress which could expose banks like Preferred Bank to vulnerabilities. Since its financial standing can unexpectedly decline in the case of an adverse macro event such as political instability, it is important to understand how prudent the bank is at managing its risk levels. Low levels of leverage coupled with sufficient liquidity may place Preferred Bank in a safe position in the face of adverse headwinds. We can measure this risk exposure by analysing three metrics for leverage and liquidity which I will take you through today. Check out our latest analysis for Preferred Bank
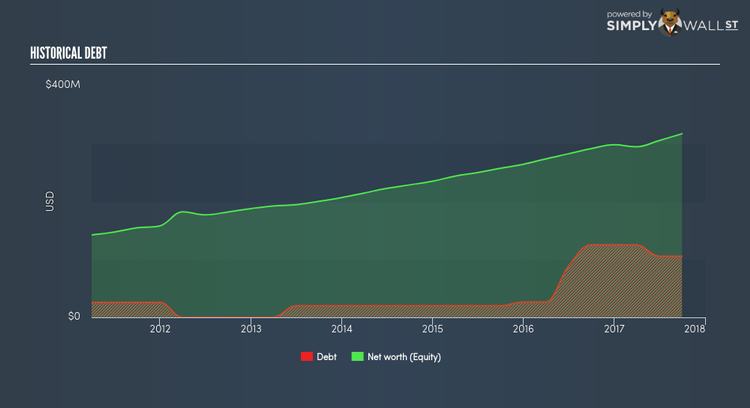
Why Does PFBC’s Leverage Matter?
A low level of leverage subjects a bank to less risk and enhances its ability to pay back its debtors. Leverage can be thought of as the amount of assets a bank owns relative to its shareholders’ funds. While financial companies will always have some leverage for a sufficient capital buffer, Preferred Bank’s leverage ratio of less than the suitable maximum level of 20x, at 12x, is considered to be very cautious and prudent. This means the bank exhibits very strong leverage management and is well-positioned to repay its debtors in the case of any adverse events since it has an appropriately high level of equity relative to the debt it has taken on to remain in business. If the bank needs to firm up its capital cushion, it has ample headroom to increase its debt level without deteriorating its financial position.
How Should We Measure PFBC’s Liquidity?

As abovementioned, loans are quite illiquid so it is important to understand how much of these loans make up Preferred Bank’s total assets. Normally, they should not exceed 70% of total assets, but its current level of 77.66% means the bank has lent out 8% above the sensible upper limit. This means its revenue is reliant on these specific assets which means the bank is also more likely to be exposed to default compared to its competitors with less loans.
What is PFBC’s Liquidity Discrepancy?
CBA profits by lending out its customers’ deposits as loans and charge an interest on the principle. Loans are generally fixed term which means they cannot be readily realized, conversely, on the liability side, customer deposits must be paid in very short notice and on-demand. The disparity between the immediacy of deposits compared to the illiquid nature of loans puts pressure on the bank’s financial position if an adverse event requires the bank to repay its depositors. Compared to the appropriate industry loan to deposit level of 90%, Preferred Bank’s ratio of over 89.11% is sensibly lower and within the safe margin, which positions the bank cautiously in terms of liquidity as it has not disproportionately lent out its deposits and has retained an apt level of deposits.
Conclusion
The bank’s liquidity and leverage ratios suggest its sensible operational risk management. This means it is well-placed to meet its financial obligations in the case of any adverse and unpredictable macro events. Today, we’ve only explored one aspect of Preferred Bank. However, as a potential stock investment, there are many more fundamentals you need to consider. Below, I’ve compiled three pertinent aspects you should further examine:
1. Future Outlook: What are well-informed industry analysts predicting for PFBC’s future growth? Take a look at our free research report of analyst consensus for PFBC’s outlook.
2. Valuation: What is PFBC worth today? Has the future growth potential already been factored into the price? The intrinsic value infographic in our free research report helps visualize whether PFBC is currently mispriced by the market.
3. Other High-Performing Stocks: Are there other stocks that provide better prospects with proven track records? Explore our free list of these great stocks here.
To help readers see pass the short term volatility of the financial market, we aim to bring you a long-term focused research analysis purely driven by fundamental data. Note that our analysis does not factor in the latest price sensitive company announcements.
The author is an independent contributor and at the time of publication had no position in the stocks mentioned.
