Is TIER 1 Technology SA’s (BME:TR1) Balance Sheet Strong Enough To Weather A Storm?

Investors are always looking for growth in small-cap stocks like TIER 1 Technology SA (BME:TR1), with a market cap of €18m. However, an important fact which most ignore is: how financially healthy is the business? Software companies, even ones that are profitable, are inclined towards being higher risk. Evaluating financial health as part of your investment thesis is crucial. I believe these basic checks tell most of the story you need to know. However, this commentary is still very high-level, so I’d encourage you to dig deeper yourself into TR1 here.
How much cash does TR1 generate through its operations?
TR1 has sustained its debt level by about €1.1m over the last 12 months made up of current and long term debt. At this current level of debt, TR1 currently has €1.3m remaining in cash and short-term investments , ready to deploy into the business. Additionally, TR1 has generated cash from operations of €203k during the same period of time, leading to an operating cash to total debt ratio of 18%, meaning that TR1’s debt is not appropriately covered by operating cash. This ratio can also be interpreted as a measure of efficiency as an alternative to return on assets. In TR1’s case, it is able to generate 0.18x cash from its debt capital.
Does TR1’s liquid assets cover its short-term commitments?
With current liabilities at €2.6m, it appears that the company has been able to meet these commitments with a current assets level of €5.1m, leading to a 2x current account ratio. Usually, for Software companies, this is a suitable ratio since there’s a sufficient cash cushion without leaving too much capital idle or in low-earning investments.
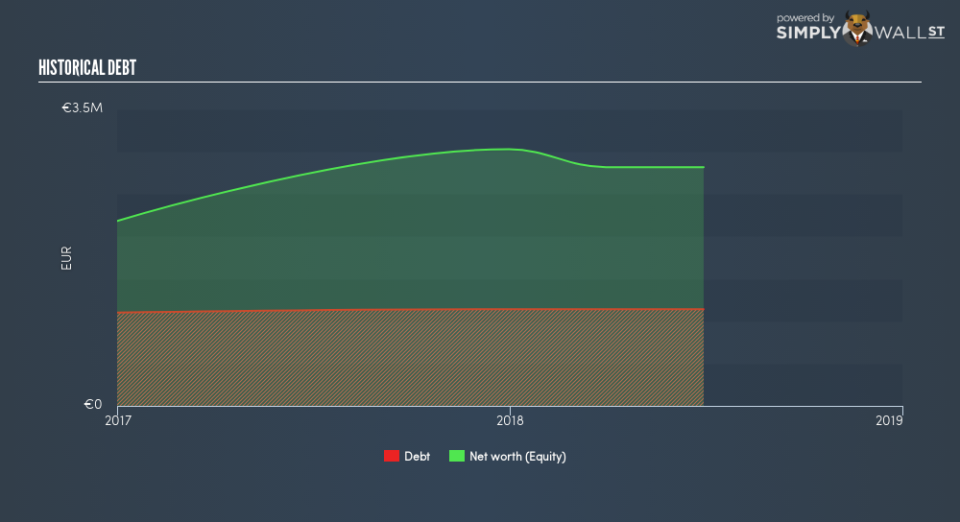
Can TR1 service its debt comfortably?
With debt reaching 40% of equity, TR1 may be thought of as relatively highly levered. This is not unusual for small-caps as debt tends to be a cheaper and faster source of funding for some businesses. We can test if TR1’s debt levels are sustainable by measuring interest payments against earnings of a company. Ideally, earnings before interest and tax (EBIT) should cover net interest by at least three times. For TR1, the ratio of 202x suggests that interest is comfortably covered, which means that lenders may be inclined to lend more money to the company, as it is seen as safe in terms of payback.
Next Steps:
At its current level of cash flow coverage, TR1 has room for improvement to better cushion for events which may require debt repayment. However, the company exhibits proper management of current assets and upcoming liabilities. I admit this is a fairly basic analysis for TR1’s financial health. Other important fundamentals need to be considered alongside. I recommend you continue to research TIER 1 Technology to get a more holistic view of the stock by looking at:
Future Outlook: What are well-informed industry analysts predicting for TR1’s future growth? Take a look at our free research report of analyst consensus for TR1’s outlook.
Valuation: What is TR1 worth today? Is the stock undervalued, even when its growth outlook is factored into its intrinsic value? The intrinsic value infographic in our free research report helps visualize whether TR1 is currently mispriced by the market.
Other High-Performing Stocks: Are there other stocks that provide better prospects with proven track records? Explore our free list of these great stocks here.
To help readers see past the short term volatility of the financial market, we aim to bring you a long-term focused research analysis purely driven by fundamental data. Note that our analysis does not factor in the latest price-sensitive company announcements.
The author is an independent contributor and at the time of publication had no position in the stocks mentioned. For errors that warrant correction please contact the editor at editorial-team@simplywallst.com.
