TMX Group Limited (TSX:X): Can It Deliver A Superior ROE To The Industry?

TMX Group Limited’s (TSX:X) most recent return on equity was a substandard 7.00% relative to its industry performance of 7.78% over the past year. An investor may attribute an inferior ROE to a relatively inefficient performance, and whilst this can often be the case, knowing the nuts and bolts of the ROE calculation may change that perspective and give you a deeper insight into X’s past performance. Metrics such as financial leverage can impact the level of ROE which in turn can affect the sustainability of X’s returns. Let me show you what I mean by this. See our latest analysis for X
Breaking down Return on Equity
Return on Equity (ROE) weighs X’s profit against the level of its shareholders’ equity. For example, if X invests $1 in the form of equity, it will generate $0.07 in earnings from this. Generally speaking, a higher ROE is preferred; however, there are other factors we must also consider before making any conclusions.
Return on Equity = Net Profit ÷ Shareholders Equity
ROE is assessed against cost of equity, which is measured using the Capital Asset Pricing Model (CAPM) – but let’s not dive into the details of that today. For now, let’s just look at the cost of equity number for X, which is 8.49%. Given a discrepancy of -1.49% between return and cost, this indicated that X may be paying more for its capital than what it’s generating in return. ROE can be split up into three useful ratios: net profit margin, asset turnover, and financial leverage. This is called the Dupont Formula:
Dupont Formula
ROE = profit margin × asset turnover × financial leverage
ROE = (annual net profit ÷ sales) × (sales ÷ assets) × (assets ÷ shareholders’ equity)
ROE = annual net profit ÷ shareholders’ equity

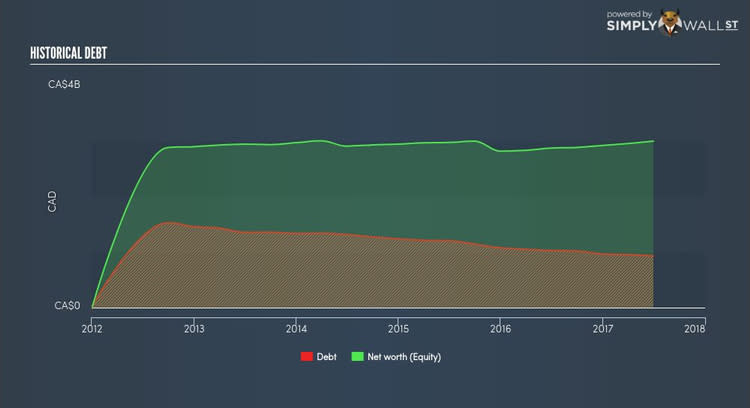
Basically, profit margin measures how much of revenue trickles down into earnings which illustrates how efficient X is with its cost management. The other component, asset turnover, illustrates how much revenue X can make from its asset base. And finally, financial leverage is simply how much of assets are funded by equity, which exhibits how sustainable X’s capital structure is. Since ROE can be artificially increased through excessive borrowing, we should check X’s historic debt-to-equity ratio. The debt-to-equity ratio currently stands at a low 31.03%, meaning X still has headroom to borrow debt to increase profits.
What this means for you:
Are you a shareholder? X’s ROE is underwhelming relative to the industry average, and its returns were also not strong enough to cover its own cost of equity. Since its existing ROE is not fuelled by unsustainable debt, investors shouldn’t give up as X still has capacity to improve shareholder returns by borrowing to invest in new projects in the future. If you’re looking for new ideas for high-returning stocks, you should take a look at our free platform to see the list of stocks with Return on Equity over 20%.
Are you a potential investor? If you are considering investing in X, looking at ROE on its own is not enough to make a well-informed decision. I recommend you do additional fundamental analysis by looking through our most recent infographic report on TMX Group to help you make a more informed investment decision.
To help readers see pass the short term volatility of the financial market, we aim to bring you a long-term focused research analysis purely driven by fundamental data. Note that our analysis does not factor in the latest price sensitive company announcements.
The author is an independent contributor and at the time of publication had no position in the stocks mentioned.
