Who Are The Top Investors In EOG Resources Inc (NYSE:EOG)?

Today, I will be analyzing EOG Resources Inc’s (NYSE:EOG) recent ownership structure, an important but not-so-popular subject among individual investors. Ownership structure of a company has been found to affect share performance over time. Since the effect of an active institutional investor with a similar ownership as a passive pension-fund can be vastly different on a company’s corporate governance and accountability of shareholders, investors should take a closer look at EOG’s shareholder registry.
View our latest analysis for EOG Resources
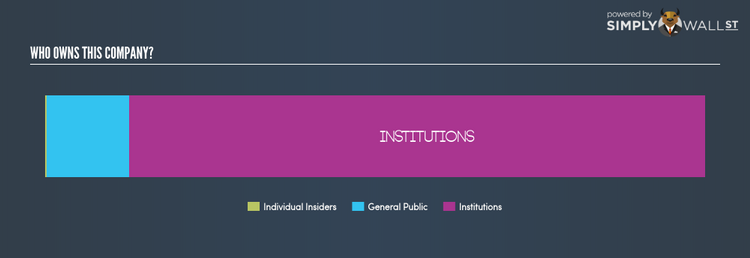
Institutional Ownership
With an institutional ownership of 87.16%, EOG can face volatile stock price movements if institutions execute block trades on the open market, more so, when there are relatively small amounts of shares available on the market to trade Although EOG has a high institutional ownership, such stock moves, in the short-term, are more commonly linked to a particular type of active institutional investors – hedge funds. For shareholders in EOG, sharp price movements may not be a major concern as active hedge funds hold a relatively small stake in the company. Although this doesn’t necessarily lead to high short-term volatility, we should dig deeper into EOG’s ownership structure to find how the remaining owner types can affect its investment profile.
Insider Ownership
Another important group of shareholders are company insiders. Insider ownership has to do more with how the company is managed and less to do with the direct impact of the magnitude of shares trading on the market. Although individuals in EOG hold only a minor stake, given EOG is a large-cap company, it is relatively meaningful. This is a good sign for shareholders as the company’s executives and directors have their incentives directly linked to the company’s performance. I will also like to check what insiders have been doing recently with their holdings. Insider buying may be a sign of upbeat future expectations, however, selling doesn’t necessarily mean the opposite as insiders may be motivated by their personal financial needs.
General Public Ownership
A big stake of 12.46% in EOG is held by the general public. This size of ownership gives retail investors collective power in deciding on major policy decisions such as executive compensation, appointment of directors and acquisitions of businesses. This level of ownership gives retail investors the power to sway key policy decisions such as board composition, executive compensation, and potential acquisitions. This is a positive sign for an investor who wants to be involved in key decision-making of the company.
Next Steps:
EOG’s considerably high level of institutional ownership calls for further analysis into its margin of safety. This will enable shareholders to comfortably invest in the company while avoid getting trapped in a sustained sell-off that is often observed in stocks with this level of institutional participation. However, if you are building an investment case for EOG, ownership structure alone should not dictate your decision to buy or sell the stock. Rather, you should be looking at fundamental drivers such as EOG Resources’s past track record and financial health. I highly recommend you to complete your research by taking a look at the following:
Future Outlook: What are well-informed industry analysts predicting for EOG’s future growth? Take a look at our free research report of analyst consensus for EOG’s outlook.
Past Track Record: Has EOG been consistently performing well irrespective of the ups and downs in the market? Go into more detail in the past performance analysis and take a look at the free visual representations of EOG’s historicals for more clarity.
Other High-Performing Stocks: Are there other stocks that provide better prospects with proven track records? Explore our free list of these great stocks here.
NB: Figures in this article are calculated using data from the last twelve months, which refer to the 12-month period ending on the last date of the month the financial statement is dated. This may not be consistent with full year annual report figures.
To help readers see pass the short term volatility of the financial market, we aim to bring you a long-term focused research analysis purely driven by fundamental data. Note that our analysis does not factor in the latest price sensitive company announcements.
The author is an independent contributor and at the time of publication had no position in the stocks mentioned.
