TPI Composites Inc (NASDAQ:TPIC) Delivered A Better ROE Than The Industry, Here’s Why

TPI Composites Inc (NASDAQ:TPIC) outperformed the Heavy Electrical Equipment industry on the basis of its ROE – producing a higher 27.20% relative to the peer average of 10.45% over the past 12 months. While the impressive ratio tells us that TPIC has made significant profits from little equity capital, ROE doesn’t tell us if TPIC has borrowed debt to make this happen. In this article, we’ll closely examine some factors like financial leverage to evaluate the sustainability of TPIC’s ROE. Check out our latest analysis for TPI Composites
Peeling the layers of ROE – trisecting a company’s profitability
Return on Equity (ROE) is a measure of TPI Composites’s profit relative to its shareholders’ equity. It essentially shows how much the company can generate in earnings given the amount of equity it has raised. Generally speaking, a higher ROE is preferred; however, there are other factors we must also consider before making any conclusions.
Return on Equity = Net Profit ÷ Shareholders Equity
ROE is measured against cost of equity in order to determine the efficiency of TPI Composites’s equity capital deployed. Its cost of equity is 10.84%. This means TPI Composites returns enough to cover its own cost of equity, with a buffer of 16.36%. This sustainable practice implies that the company pays less for its capital than what it generates in return. ROE can be dissected into three distinct ratios: net profit margin, asset turnover, and financial leverage. This is called the Dupont Formula:
Dupont Formula
ROE = profit margin × asset turnover × financial leverage
ROE = (annual net profit ÷ sales) × (sales ÷ assets) × (assets ÷ shareholders’ equity)
ROE = annual net profit ÷ shareholders’ equity

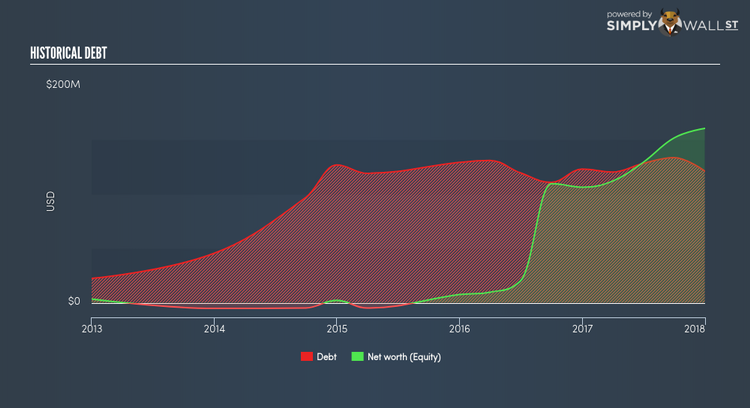
Essentially, profit margin shows how much money the company makes after paying for all its expenses. Asset turnover shows how much revenue TPI Composites can generate with its current asset base. The most interesting ratio, and reflective of sustainability of its ROE, is financial leverage. Since ROE can be artificially increased through excessive borrowing, we should check TPI Composites’s historic debt-to-equity ratio. At 75.57%, TPI Composites’s debt-to-equity ratio appears sensible and indicates the above-average ROE is generated from its capacity to increase profit without a large debt burden.
Next Steps:
ROE is one of many ratios which meaningfully dissects financial statements, which illustrates the quality of a company. TPI Composites’s above-industry ROE is encouraging, and is also in excess of its cost of equity. ROE is not likely to be inflated by excessive debt funding, giving shareholders more conviction in the sustainability of high returns. Although ROE can be a useful metric, it is only a small part of diligent research.
For TPI Composites, I’ve put together three pertinent factors you should further examine:
Financial Health: Does it have a healthy balance sheet? Take a look at our free balance sheet analysis with six simple checks on key factors like leverage and risk.
Valuation: What is TPI Composites worth today? Is the stock undervalued, even when its growth outlook is factored into its intrinsic value? The intrinsic value infographic in our free research report helps visualize whether TPI Composites is currently mispriced by the market.
Other High-Growth Alternatives : Are there other high-growth stocks you could be holding instead of TPI Composites? Explore our interactive list of stocks with large growth potential to get an idea of what else is out there you may be missing!
To help readers see pass the short term volatility of the financial market, we aim to bring you a long-term focused research analysis purely driven by fundamental data. Note that our analysis does not factor in the latest price sensitive company announcements.
The author is an independent contributor and at the time of publication had no position in the stocks mentioned.
