How to Trade the Breakout in Exxon Mobil Stock
The recovery in Exxon Mobil (NYSE:XOM) reached new heights this week amid continued bullish behavior from crude oil. Black gold is fast approaching $40 after notching its best month ever. Against that backdrop, the angst surrounding the debt-laden energy sector has dissipated. And just like that, Exxon Mobil stock is back to where it was when the Saudi-Russia oil war delivered a massive shock to the energy patch on March 9.

Source: Harry Green / Shutterstock.com
Let’s take a fresh look at the improving technicals in oil and Exxon Mobil. Then we’ll walk through how to profit from the continued recovery using a leveraged options trade.
Oil’s Meltup
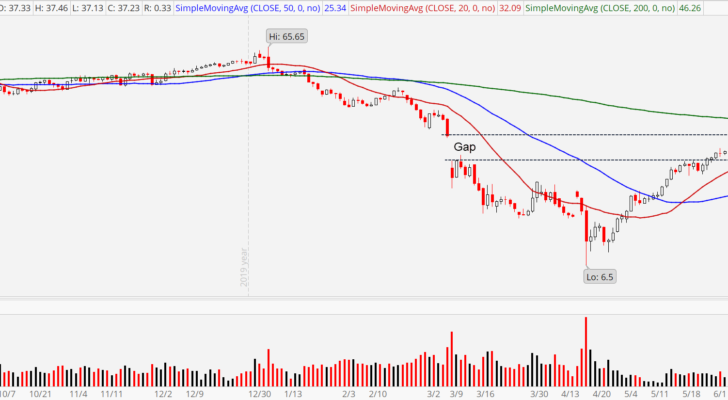
Source: The thinkorswim® platform from TD Ameritrade
May went down in this history books as the best month ever for oil prices. West Texas Intermediate rallied 85%, as traders pulled its depressed price back from the abyss. The jump from $19 to $35 was relentless, with only a few pauses along the way. Reopening economies are helping on the demand side with consumers hitting the road and air traffic ticking higher. Meanwhile, historic production cuts are keeping the oil flow to a trickle to help on the supply side.
InvestorPlace - Stock Market News, Stock Advice & Trading Tips
Pessimists will say oil remains well off its 2020 highs of $65.65, so keep the giddiness in check. The point is valid, but for heaven’s sake, crude was flirting with negative numbers just six weeks ago! The recovery has been utterly astounding in its consistency and strength. We’ve only seen one or two red candles the entire way up. Filling the gap left by March 9’s epic overnight plunge seems highly likely in the short run. That would carry oil up to $41.50.
A Look at the Exxon Mobil Stock Charts
Source: The thinkorswim® platform from TD Ameritrade
For its part, Exxon Mobil’s stock has now lifted 63% off the lows. Along the way, the 20-day and 50-day moving averages have turned up, officially reversing the short-term and intermediate-term trends higher. Volume patterns also remain healthy, particularly since the false breakdown in early May. Multiple accumulation days have cropped up since to reflect institutions returning to the oil giant.
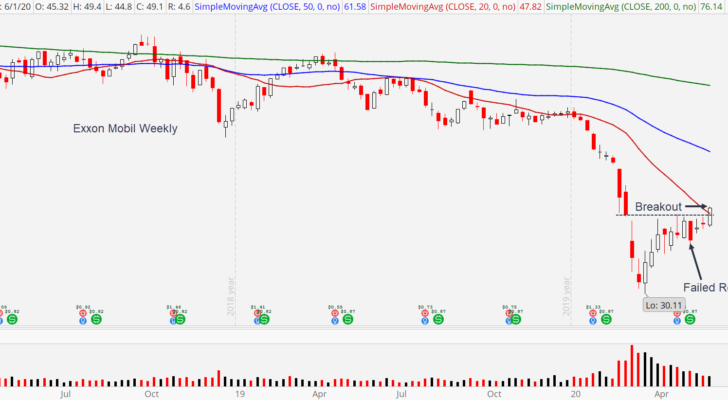
The fear gripping traders ever since the March bottom was that the rebound was only a dead-cat bounce. We now have enough evidence, however, to put that particular theory to rest. The first sign that this bounce had staying power was the failed breakdown I just mentioned from early-May. If sellers were in control, Exxon Mobil would have tumbled from that point forward. But it didn’t. The support breach was a ruse, a bear trap. And now, we’ve taken out the topside of the consolidation zone, as well as the 20-week moving average.

Source: The thinkorswim® platform from TD Ameritrade
That should be enough evidence for any chart follower to abandon bearish aspirations and start giving the daily uptrend the benefit of the doubt. This week’s rally officially completes the ascending triangle pattern of the last two months and sets the stage for a run to the next ceiling at $54.
How to Trade Exxon Mobil Stock Now
With uncertainty and realized volatility dwindling, options’ demand has fallen dramatically. Exxon Mobil derivatives now carry an implied volatility rank of 26%. Couple that with the relatively low share price of $49, and a bull call diagonal spread looks good here.
The trade consists of buying a longer-term in-the-money call option and selling a short-term out-of-the-money call option against it to generate cash flow and reduce trade cost.
The trade? Buy the Aug $47.50 call while selling the July $52.50 call for a net debit around $3.10.
Your original cost of $3.10 is the max loss and will be forfeited if Exxon sits below $47.50 at August expiration. I would plan on closing the trade at July expiration, though. Or, exit earlier if the stock breaks support near $42. Your loss will be around $2.
If Exxon can work its way toward $52.50, your max upside is around $1.50 to $2, which works out to a tasty 50% to 65% return on investment.
For a free trial to the best trading community on the planet and Tyler’s current home, click here! As of this writing, Tyler held bullish positions in XOM.
More From InvestorPlace
The post How to Trade the Breakout in Exxon Mobil Stock appeared first on InvestorPlace.
