Trade of the Day: Apache Stock Looks Ripe to Gush Higher
The price of oil has rallied about 40% year to date, and while energy stocks are also trading higher as a sector of the S&P 500, there looks to be plenty of pop left in them. Through the lens of technical analysis, many of the oil exploration and development stocks such as Apache Corp (NYSE:APA) are coiling tight below well-defined technical resistance and looking giddy for a move higher.
A conversation with a well-known money manager the other day reminded me to remind ye faithful readers of this column about the importance of patience in trading and investing. Price will come to those who wait, which is another way of saying that chasing charts is a bad habit in trading and ultimately will lead to losses over the longer term.
Patience also means that when entering any given trade hoping for a price “breakout,” it is essential to understand that just because you bought this stock doesn’t mean it is ready to rip higher that very moment. Often times a qualified breakout will ultimately happen, but only after another few days, weeks or even months of more sideways movement.
InvestorPlace - Stock Market News, Stock Advice & Trading Tips
APA Stock Charts
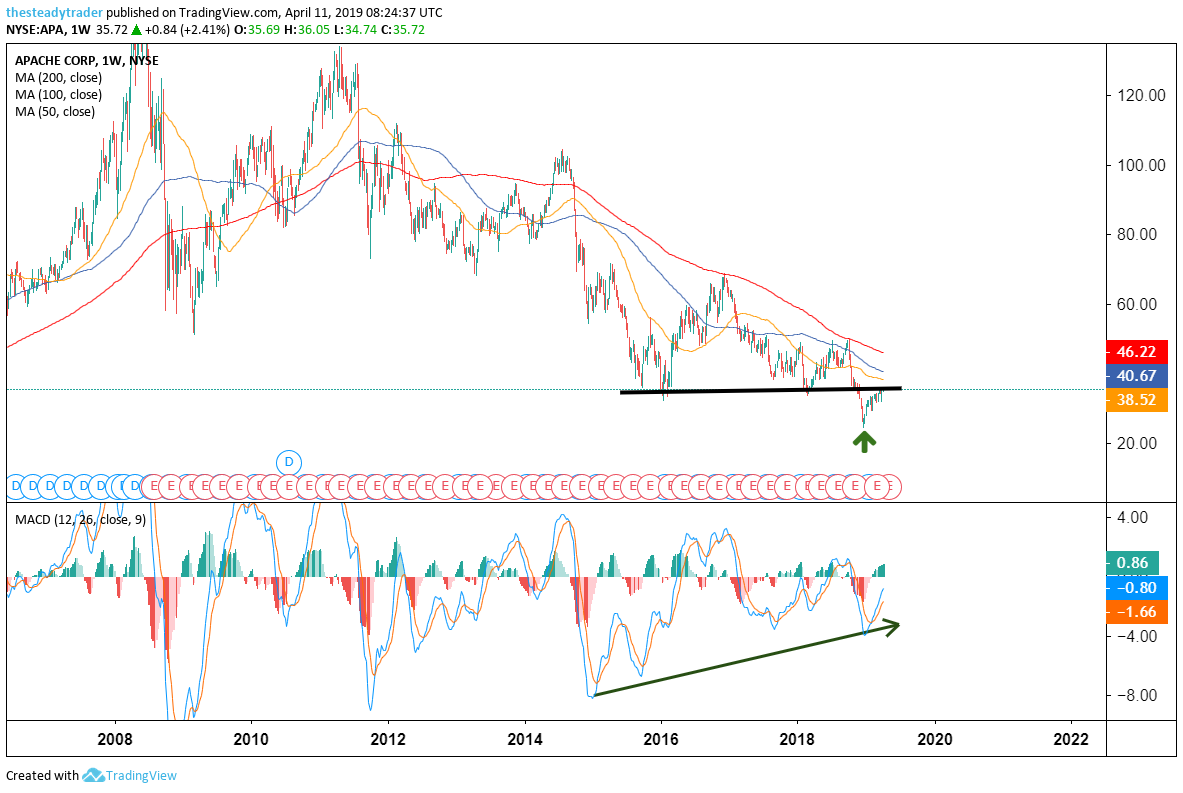
Moving averages legend: red – 200 week, blue – 100 week, yellow – 50 week
With that in mind, let’s look at the longer-term chart of APA stock and note that it has been in a down-trend since 2011. Furthermore, in December 2018 this stock took another leg lower by snapping a multiyear horizontal support line around the $35 area.
The stock has since rebounded back to this former breakdown area while from a momentum perspective we are seeing “positive divergence” from price. Thus the question I am pondering is whether the December 2018 breakdown in the stock was a breakdown fake-out move?
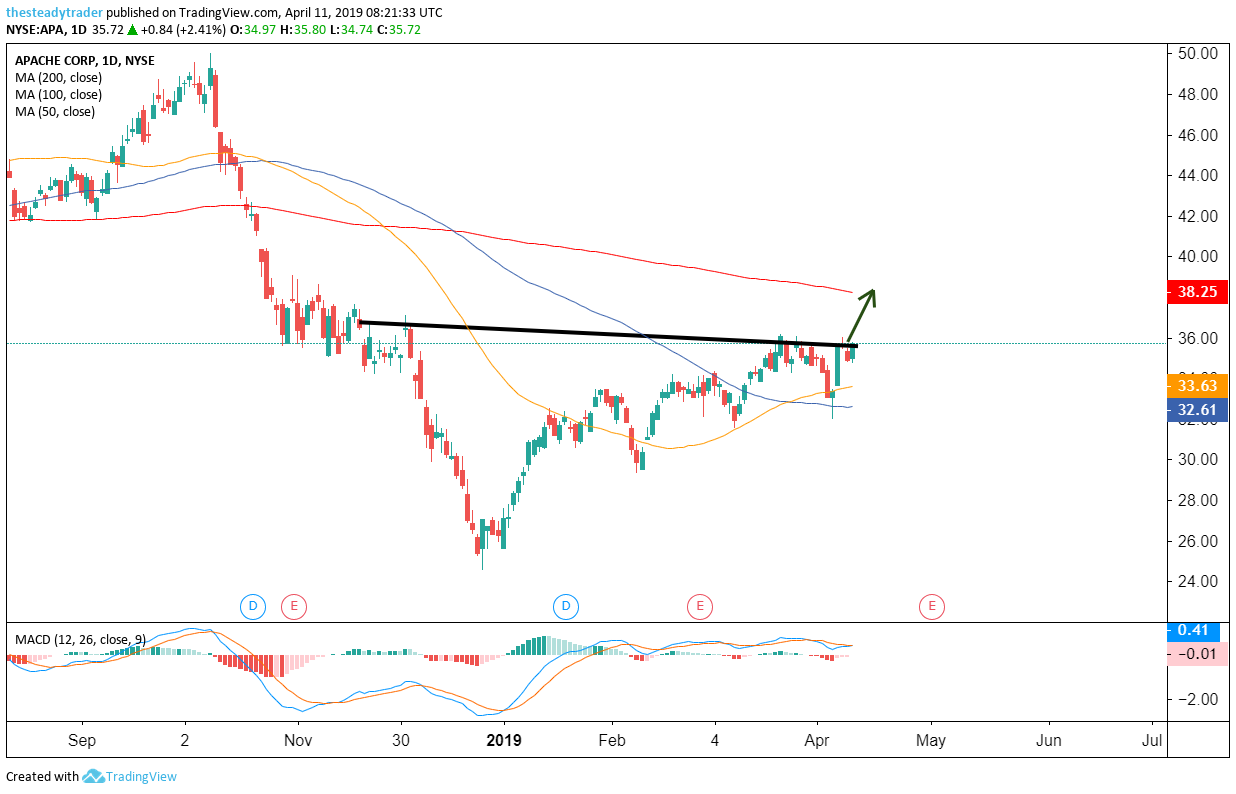
Moving averages legend: red – 200 day, blue – 100 day, yellow – 50 day
On the daily chart, we see that APA stock has rebounded sharply off the late December 2018 lows and that since March it is finding good support at its yellow 50-day moving average. Most recently on April 4 the stock attempted to break down but again found support at said moving average, which was followed the next day by more buying.
The $36 area has offered well-defined technical resistance the past few weeks and considering the notable bullish reversal from April 4 and 5 we are now seeing more pressure being applied on the $36 area, where I think the stock could be bought for a trade. A next upside target now becomes the red 200-day moving average around the $38 area while any strong bearish reversal on a weekly closing basis would be a stop loss signal.
Get FREE ACCESS to Serge’s renowned Stock Market Scanner with actionable trade ideas. Get it HERE.
More From InvestorPlace
The post Trade of the Day: Apache Stock Looks Ripe to Gush Higher appeared first on InvestorPlace.
