Trade of the Day: Market Vectors Gold Miners ETF (GDX) Is Shining (For Now)
InvestorPlace - Stock Market News, Stock Advice & Trading Tips
While stocks struggled this past week, a bid in gold and gold mining stocks took hold that, from at least from a pure price action perspective, was difficult to ignore or disrespect. Will the Market Vectors Gold Miners ETF (NYSEARCA:GDX) see follow-through buying in coming weeks, and will this finally lead to a more sustainable breakout?

Source: Shutterstock
Before digging into some perspective and charts, allow me to make clear that gold mining stocks as represented by the GDX ETF can be a volatile bunch and over the years have seem more false moves (breakouts or breakdowns) than many a trader will care to acknowledge. Nonetheless, the current technical setup and volatility backdrop in the broader equity markets does warrant a closer look at the gold mining stocks for a trade, for now.
The price of gold as represented by the popular SPDR Gold Trust (ETF) (NYSEARCA:GLD) rallied about 2.6% last week in what was one of its best moves in months.
To be clear, the rally in gold and gold mining stocks did coincide with last week’s risk-off move in stocks on the back of jitters around geopolitical risk from North Korea. In other words, should these jitters quickly subside again it is theoretically possible that last week’s rally in gold and gold mining stocks could fizzle just as quickly.
GDX Stock Charts
Moving averages legend: red – 200 week, blue – 100 week, yellow – 50 week
Nonetheless, it rarely pays to ignore price action, particularly when a chart is giving similar signals in multiple time frames.
On the multiyear weekly chart, we see that a wedge has developed (black lines) that has its 200- and 100- week moving averages as support while the yellow 50-week average is acting as resistance.
Additionally, last week’s rally left a so called bullish outside or “engulfing” candle behind on the weekly chart of the GDX ETF, all of which does look to point the path of least resistance being to the upside.
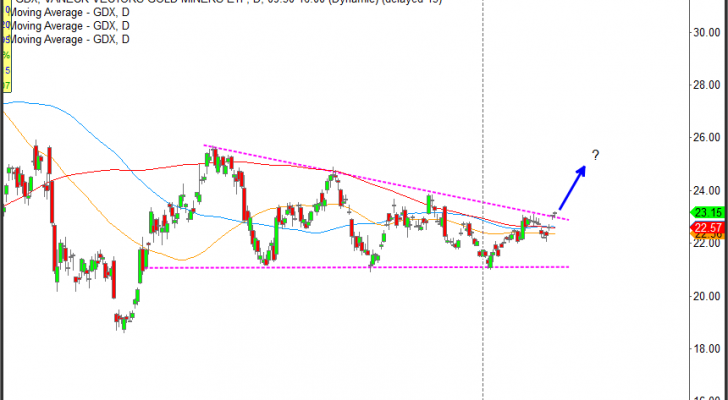
Moving averages legend: red – 200 day, blue – 100 day, yellow – 50 day
On the daily chart, we see that the GDX ETF last week managed to score a marginal and ever-so-tight breakout past diagonal resistance in an attempt to break the series of lower highs since early this year.
Rather than overcomplicating things, here is what I am considering; Buy the GDX ETF around the $23-$23.50 area, or buy bull call spreads with at least two months left to expiration, with a next upside target around the $25 mark. Any strong bearish reversal, particularly if accompanied by a strong rebound in the broader stock market, could be used as a stop loss signal.
Check out Serge’s Daily Market Outlook for Aug. 14.
Tell us what you think about this article! Drop us an email at editor@investorplace.com, chat with us on Twitter at @InvestorPlace or comment on the post on Facebook. Read more about our comments policy here.
Take Serge’s quiz to find out which trading strategy best suits your personality.
More From InvestorPlace
7 Hot Stocks to Buy Before Wall Street Pros Send Them Higher
Nvidia Corporation (NVDA) Growth Soars as Competition Encroaches
The post Trade of the Day: Market Vectors Gold Miners ETF (GDX) Is Shining (For Now) appeared first on InvestorPlace.


