What Trade War? Emerging Markets Defy The Odds By Rolling With The Punches

Among the many curveballs the global economy has thrown at investors this year, one of the least expected might be the traction emerging markets have seen in the opening months of the year. Take a look at the year-to-date chart for the Direxion Daily MSCI Emerging Markets Bull 3X Shares (NYSE: EDC) against that of the broad market U.S. equity represented by the Direxion Daily S&P 500 Bull 3X Shares (NYSE: SPXL).
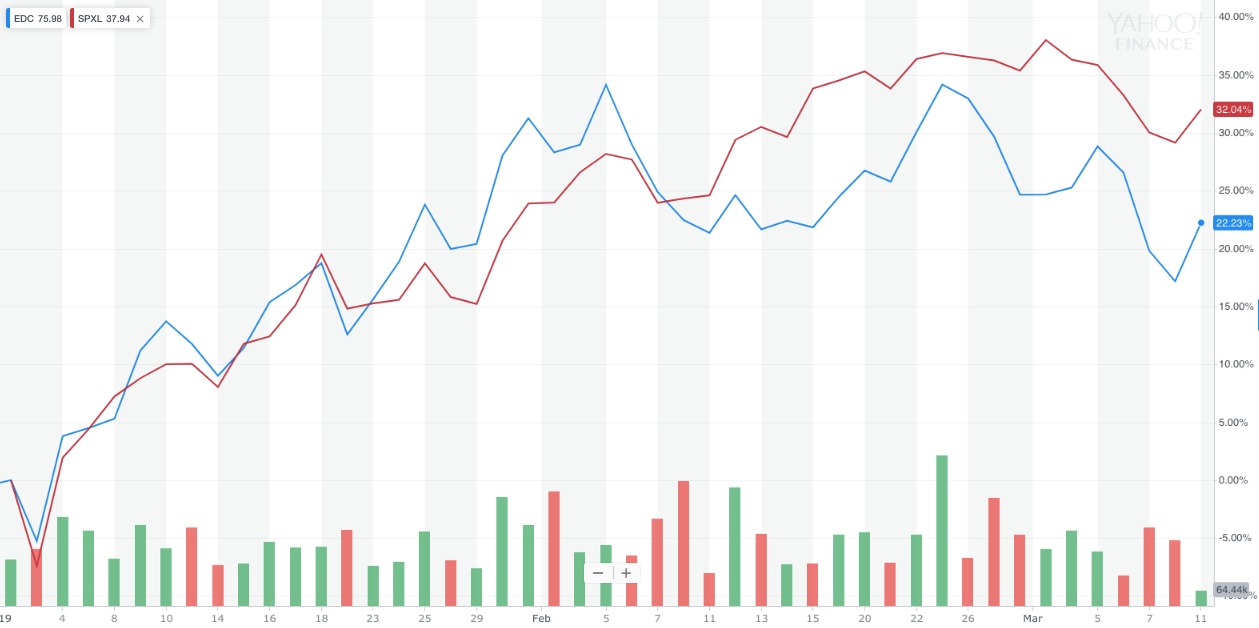
Source: Yahoo Finance. Data as of March 11, 2019. Past performance is not indicative of future results. Investment return and principal value of an investment will fluctuate so that an investor's shares, when redeemed, may be worth more or less than their original cost. Current performance may be lower or higher than the performance data quoted. For standardized performance, click here.
The two charts were neck-and-neck for much of the start of the year, only diverging late February due to a slight rise in energy prices and persistent investor anxiety surrounding international trade disputes.
This is pretty astounding given the headwinds emerging economies seemed to be facing coming into 2019. The U.S. dollar remains near historical highs according to the currency basket-pegged dollar index, and a high dollar valuation usually prices out many emerging market economies from raw materials that are priced in USD. That, coupled with U.S. equities experiencing some of the strongest months it’s seen in years, would traditionally make emerging markets a much less appealing investment class than it currently seems to be.
Then, of course, there is the ongoing U.S.-China trade war, which prompted a massive outflow of capital investments in EM economies late in 2018, and is still expected to hit emerging markets hard. Overall, the global economic picture is expected to tighten over the course of the year anyway, whether or not the U.S. and China resolve their differences.
In light of all of that, how can the EDC be up 22 percent YTD?
Well, the announced delay of additional tariffs from the U.S. on another $200 billion in Chinese goods in late February helped the Chinese and Taiwanese components of the ETF, which account for just over a third of its makeup.
However, several smaller developments in global finance sent bullish signals to investors that emerging markets might still have room to run. Earlier in the month, India’s central bank surprised markets by lowering interest rates after a pair of increases over 2018.
The biggest catalyst underlying the strength of emerging markets might lie in trade activity in Southeast Asia. As the trade war between the two of the region’s top trading partners progressed, some of the region’s biggest economies like Malaysia, Thailand, and Indonesia experienced a massive influx of export demand and overall economic activity. In the case of the former, Malaysia had its highest trade surplus in more than five years over the course of 2018, while Thailand and Indonesia each marked 4.1 and 5.17 percent annual GDP growth, an increase of 1.3 and 2.5 percent over their respective 2017 GDP.
While these trends are still playing out, other factors may cause the worm to turn on emerging markets. For one, copper prices have been on the rise recently. While high demand in the material usually suggests strong economic development, since copper is so widely used in all areas of production and manufacturing, the uptick might end up slowing demand should the global economic picture dim as many economists predict. What’s more, if the dollar does come back down to orbit, commodity prices across the board will likely rise, since they generally have an inverse relationship to the USD.
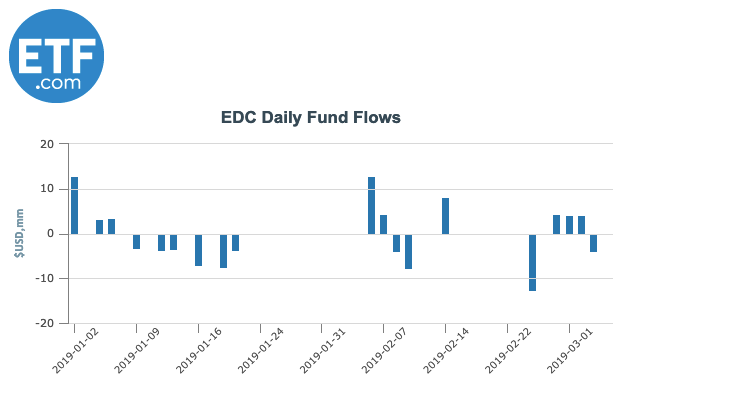
Proof of this can be seen below in the fund flow data for EDC. As you might expect, as the ETF had gained traction through the first two months of 2019, traders and investors have been gradually taking profits to the tune of about $1.56 million in outflows YTD.
By that same token, inflow for the Direxion Daily MSCI Emerging Markets Bear 3X Shares (NYSE: EDZ) has ticked up more than $10 million in inflow since the start of the year.
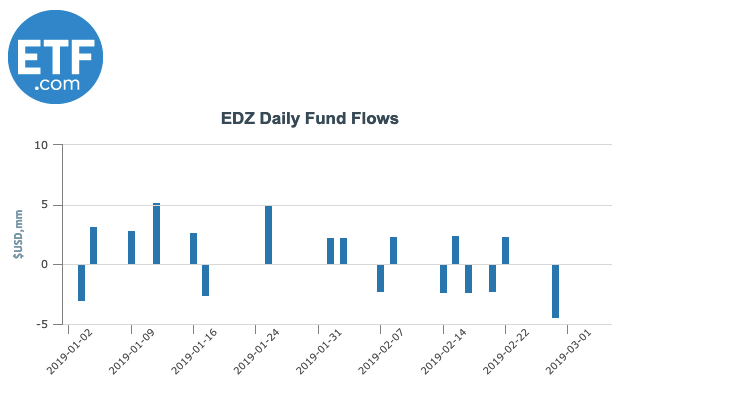
At the moment though, things still seem to be going swimmingly for emerging market economies, which you can see in the wavering investment and redemption in EDZ through February. That positive trend will likely find another wind if and when a trade agreement between the U.S. and China materializes.
However, keep an eye on activity coming out of both emerging market economies and major central banks. Monetary policies, like The People’s Bank of China injecting 50 billion yuan into the economy to fight a projected economic slowdown and the U.S. Federal Reserve backing off its interest rate plan after four increases over 2018, suggest that two big players on either side of the developed/emerging equation are trying to stay ahead of any downturn that might materialize as 2019 rolls on.
An investor should carefully consider a Fund’s investment objective, risks, charges, and expenses before investing. A Fund’s prospectus and summary prospectus contain this and other information about the Direxion Shares. To obtain a Fund’s prospectus and summary prospectus call 866.476.7523 or visit our website at direxioninvestments.com. A Fund’s prospectus and summary prospectus should be read carefully before investing.
Shares of the Direxion Shares are bought and sold at market price (not NAV) and are not individually redeemed from a Fund. Market Price returns are based upon the midpoint of the bid/ask spread at 4:00 pm EST (when NAV is normally calculated) and do not represent the returns you would receive if you traded shares at other times. Brokerage commissions will reduce returns. Fund returns assume that dividends and capital gains distributions have been reinvested in the Fund at NAV. Some performance results reflect expense reimbursements or recoupments and fee waivers in effect during certain periods shown. Absent these reimbursements or recoupments and fee waivers, results would have been less favorable.
Investing in a Direxion Shares ETF may be more volatile than investing in broadly diversified funds. The use of leverage by an ETF increases the risk to the ETF. The Direxion Shares ETFs are not suitable for all investors and should be utilized only by sophisticated investors who understand leverage risk, consequences of seeking daily leveraged, or daily inverse leveraged, investment results and intend to actively monitor and manage their investment. The Direxion Shares ETFs are not designed to track their respective underlying indices over a period of time longer than one day.
Distributor: Foreside Fund Services, LLC.
See more from Benzinga
Why You Should Consider Adding Low Volatility ETFs To Your Portfolio
Sam Zell's CNBC Interview Reveals A Deep Schism Regarding America And Its Character
Investors Boost The IMX In February, But Seem Wary Of What The Future Holds
© 2019 Benzinga.com. Benzinga does not provide investment advice. All rights reserved.
