TransUnion (TRU) Beats on Q3 Earnings & Revenues, Ups '19 View
TransUnion TRU reported solid third-quarter 2019 results, wherein its earnings and revenues surpassed the Zacks Consensus Estimate.
Adjusted earnings of 76 cents per share outpaced the consensus mark by 5 cents and improved 16.9% year over year.
Total revenues of $689.3 million beat the consensus mark by $12.5 million and increased 14% year over year on a reported basis, 15% on a constant-currency basis and 15% on an organic constant-currency basis.
Adjusted revenues (excluding the impact of deferred revenue purchase accounting reductions and other adjustments to revenues for the company’s recently acquired entities) came in at $689 million, up 11% year over year on a reported basis, 12% at constant currency and 11% at organic constant currency.
We observe that shares of TransUnion have gained a massive 45.2% year to date, outperforming the 37.3% rally of the industry it belongs to.

Revenue Growth Across All Segments
The U.S. Markets revenues of $420 million increased 12% year over year on a reported basis and 11% on an organic basis. Within the segment, Financial Services revenues of $225 million increased 13% year over year on a reported and organic basis. Emerging Verticals revenues, including Healthcare, Insurance and all other verticals, were $195 million, up 11% year over year on a reported basis and 8% on an organic basis.
International revenues rose 24% year over year on a reported basis and 28% at constant-currency basis to $160 million. Adjusted revenues also came in at $160 million, up 10% year over year on a reported basis and 14% at constant-currency basis. Revenues from Canada, Latin America, United Kingdom, Africa, India and Asia Pacific increased year over year on a reported as well as constant-currency basis.
Revenues at the Consumer Interactive segment improved 7% from the prior-year quarter number to $128 million.
Margin Expanded
Adjusted EBITDA was $281 million, up 15% year over year on a reported basis, 16% on a constant-currency basis and 15% on an organic constant-currency basis. Adjusted EBITDA margin came in at 40.7% compared with 39.4% in the prior-year quarter.
TransUnion Price, Consensus and EPS Surprise
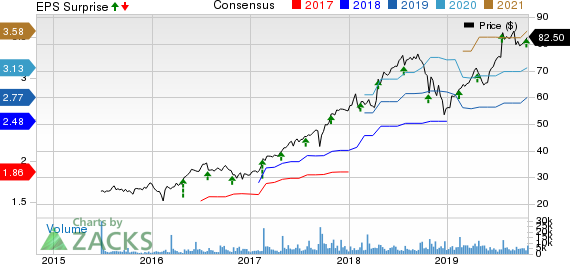
TransUnion price-consensus-eps-surprise-chart | TransUnion Quote
Balance Sheet and Cash Flow
TransUnion had $235.9 million in cash and cash equivalents at the end of third-quarter 2019 compared with $194.7 million at the end of the prior quarter. Long-term debt was $3.65 billion, compared with $3.83 billion in the prior quarter. The company generated $279.4 million in cash from operating activities and CapEx was $44.1 million. The company paid out $14.1 million in dividends in the quarter.
Q4 Outlook
For the fourth quarter of 2019, TransUnion expects adjusted revenues between $667 million and $672 million, suggesting an improvement of 7-8% year over year.
Adjusted EPS is expected between 69 cents and 71 cents, indicating a rise of 5-7% year over year. The Zacks Consensus Estimate of 71 cents came in line with the higher end of the guided range.
Adjusted EBITDA is anticipated in the range of $264-$268 million, suggesting an increase of 6-8%.
2019 View
TransUnion raised its 2019 guidance. The company now expects adjusted revenues between $2.644 billion and $2.649 billion, indicating year-over-year increase of 13%. The previous guidance was between $2.628 billion and $2.638 billion.
Adjusted EPS is anticipated in the band of $2.74-$2.76, suggesting improvement of 10%. The previous expectation was in the band of $2.66-$2.69. The Zacks Consensus Estimate of $2.77 exceeded the currently guided range.
Adjusted EBITDA is expected in the range of $1.048-$1.052 million, indicating year-over-year increase of 14-15%. The previously anticipated range was $1.036-$1.044 million.
Zacks Rank & Upcoming Releases
Currently, TransUnion carries a Zacks Rank #2 (Buy). You can see the complete list of today’s Zacks #1 Rank (Strong Buy) stocks here.
Investors interested in the broader Zacks Business Services sector are awaiting third-quarter 2019 earnings of key players like Clean Harbors CLH, Aptiv APTV and Republic Services RSG, each scheduled to release results on Oct 30.
Looking for Stocks with Skyrocketing Upside?
Zacks has just released a Special Report on the booming investment opportunities of legal marijuana.
Ignited by new referendums and legislation, this industry is expected to blast from an already robust $6.7 billion to $20.2 billion in 2021. Early investors stand to make a killing, but you have to be ready to act and know just where to look.
See the pot trades we're targeting>>
Want the latest recommendations from Zacks Investment Research? Today, you can download 7 Best Stocks for the Next 30 Days. Click to get this free report
TransUnion (TRU) : Free Stock Analysis Report
Republic Services, Inc. (RSG) : Free Stock Analysis Report
Clean Harbors, Inc. (CLH) : Free Stock Analysis Report
Aptiv PLC (APTV) : Free Stock Analysis Report
To read this article on Zacks.com click here.
Zacks Investment Research
