
Trend Followers' Favorite Gearing Up for a Quick Move Higher
Lululemon Athletica (LULU), the Vancouver-based designer and retailer of athletic apparel, has long been a favorite of traders. The stock has seen its fair share of volatility during the past few years, but has also risen dramatically.
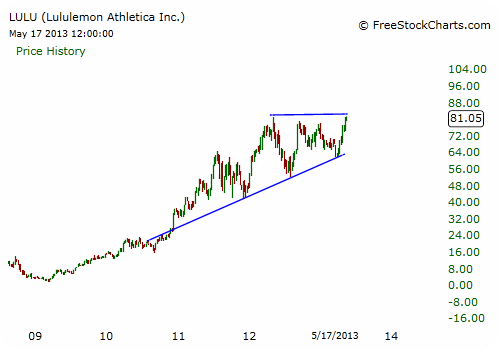
Year to date, LULU is up roughly 6%, but has rallied nearly 30% in the past six weeks alone. As a result, the stock has hit a critical resistance area, which if momentum stays with the stock, could soon be breached.
LULU has behaved like a classic trend followers' stock, with sharp rises and subsequent sell-offs. Unlike other trend follower stocks that are still rising in a vertical fashion, however, LULU's rally was followed by a nasty sell-off, and with that behind it, the stock now offers traders more clearly defined support areas and target levels.
For initial perspective, let's consider the stock's sharp rally from the 2009 broader market lows up to May 2012. In this time frame, LULU gained 3,520%, and that's no typo. The company also posted impressive top and bottom line growth during this time. In other words, it did not simply rise along with the broader market's tide.
Given the strong growth momentum, LULU quickly turned into a trend followers' favorite, which is to say any dips were immediately bought. However, the other side of the trend follower coin is that once the trend ends or the stock drops sharply in a short time frame, the herd changes direction and hastily dumps the stock.
After the already steep rise from its March 2009 lows, LULU gapped higher in 2011, going vertical until it ran out of steam in July of that year. From there, the stock retraced to a longer-term mean. Then, about six months later, it again began to rally sharply and with upside momentum that was simply not sustainable. By May 2012, LULU hit an all-time high and was overstretched. It corrected 35% in three months before finding better support at the long-term trendline.
This series of sharp rallies followed by retracements to the longer-term uptrending mean is why the stock remains well-positioned to move higher over time.
Closer up on the daily chart, the systematic rise off the December 2012 lows with a series of consolidation phases and rallies is clearly visible. After making higher lows in August 2012 and March 2013, the stock began to stage a sharp rally.
It first broke past lateral resistance around $70.50 dating back to January 2013, followed by September 2012 resistance near $79, and it now sits right at the May 2012 highs.
Given the stock's tight consolidation phases in April and again during the past few trading days, coupled with the series of higher lows, the likelihood of LULU moving up from here is high.
Furthermore, the stock's pullback to the March lows stopped right where it should have, namely the 61.8% Fibonacci support line of the rally from August to September 2012. A daily close above $81.60 could take LULU to the $85 area.

As long as the momentum stays with the stock, more upside should follow in the weeks ahead.
Recommended Trade Setup:
-- Buy LULU on a daily close above $81.60
-- Set stop-loss at $79.20
-- Set initial price target at $85 for a potential 4% gain in 3-6 weeks
Related Articles
Indicator Warns a Bear Market May be Coming in This Sector
Traders Could Book 39% Profits if This Stock Breaks Nearby Resistance
This Is Much More Important to Your Wealth Than Any Stock Pick
