Is Trinity Industries, Inc. (NYSE:TRN) Struggling With Its 3.6% Return On Capital Employed?

Today we’ll evaluate Trinity Industries, Inc. (NYSE:TRN) to determine whether it could have potential as an investment idea. Specifically, we’re going to calculate its Return On Capital Employed (ROCE), in the hopes of getting some insight into the business.
First up, we’ll look at what ROCE is and how we calculate it. Then we’ll compare its ROCE to similar companies. Then we’ll determine how its current liabilities are affecting its ROCE.
Understanding Return On Capital Employed (ROCE)
ROCE measures the amount of pre-tax profits a company can generate from the capital employed in its business. All else being equal, a better business will have a higher ROCE. Overall, it is a valuable metric that has its flaws. Author Edwin Whiting says to be careful when comparing the ROCE of different businesses, since ‘No two businesses are exactly alike.’
So, How Do We Calculate ROCE?
The formula for calculating the return on capital employed is:
Return on Capital Employed = Earnings Before Interest and Tax (EBIT) ÷ (Total Assets – Current Liabilities)
Or for Trinity Industries:
0.036 = US$266m ÷ (US$8.0b – US$580m) (Based on the trailing twelve months to December 2018.)
Therefore, Trinity Industries has an ROCE of 3.6%.
Check out our latest analysis for Trinity Industries
Does Trinity Industries Have A Good ROCE?
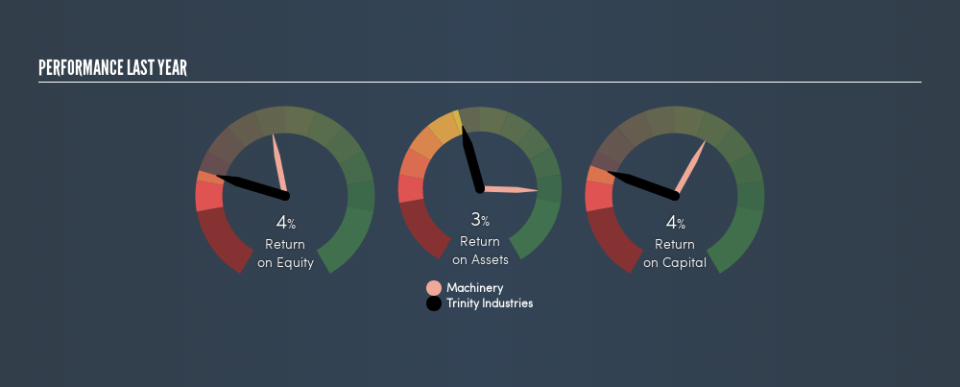
One way to assess ROCE is to compare similar companies. In this analysis, Trinity Industries’s ROCE appears meaningfully below the 12% average reported by the Machinery industry. This could be seen as a negative, as it suggests some competitors may be employing their capital more efficiently. Independently of how Trinity Industries compares to its industry, its ROCE in absolute terms is low; especially compared to the ~2.7% available in government bonds. Readers may wish to look for more rewarding investments.
As we can see, Trinity Industries currently has an ROCE of 3.6%, less than the 15% it reported 3 years ago. This makes us wonder if the business is facing new challenges.
Remember that this metric is backwards looking – it shows what has happened in the past, and does not accurately predict the future. ROCE can be deceptive for cyclical businesses, as returns can look incredible in boom times, and terribly low in downturns. ROCE is, after all, simply a snap shot of a single year. What happens in the future is pretty important for investors, so we have prepared a free report on analyst forecasts for Trinity Industries.
How Trinity Industries’s Current Liabilities Impact Its ROCE
Liabilities, such as supplier bills and bank overdrafts, are referred to as current liabilities if they need to be paid within 12 months. Due to the way the ROCE equation works, having large bills due in the near term can make it look as though a company has less capital employed, and thus a higher ROCE than usual. To check the impact of this, we calculate if a company has high current liabilities relative to its total assets.
Trinity Industries has total assets of US$8.0b and current liabilities of US$580m. Therefore its current liabilities are equivalent to approximately 7.3% of its total assets. With barely any current liabilities, there is minimal impact on Trinity Industries’s admittedly low ROCE.
What We Can Learn From Trinity Industries’s ROCE
Nonetheless, there may be better places to invest your capital. Of course, you might find a fantastic investment by looking at a few good candidates. So take a peek at this free list of companies with modest (or no) debt, trading on a P/E below 20.
I will like Trinity Industries better if I see some big insider buys. While we wait, check out this free list of growing companies with considerable, recent, insider buying.
We aim to bring you long-term focused research analysis driven by fundamental data. Note that our analysis may not factor in the latest price-sensitive company announcements or qualitative material.
If you spot an error that warrants correction, please contact the editor at editorial-team@simplywallst.com. This article by Simply Wall St is general in nature. It does not constitute a recommendation to buy or sell any stock, and does not take account of your objectives, or your financial situation. Simply Wall St has no position in the stocks mentioned. Thank you for reading.
