Is Turning Point Brands Inc’s (NYSE:TPB) Balance Sheet A Threat To Its Future?

Investors are always looking for growth in small-cap stocks like Turning Point Brands Inc (NYSE:TPB), with a market cap of US$592.34m. However, an important fact which most ignore is: how financially healthy is the business? Assessing first and foremost the financial health is crucial, since poor capital management may bring about bankruptcies, which occur at a higher rate for small-caps. Here are few basic financial health checks you should consider before taking the plunge. Though, I know these factors are very high-level, so I suggest you dig deeper yourself into TPB here.
Does TPB produce enough cash relative to debt?
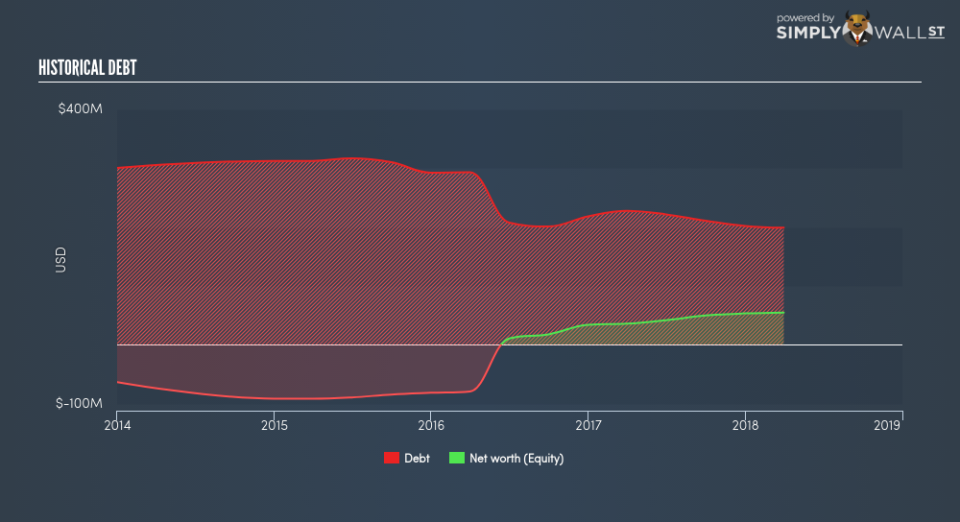
TPB’s debt levels have fallen from US$218.23m to US$202.04m over the last 12 months , which is made up of current and long term debt. With this reduction in debt, the current cash and short-term investment levels stands at US$2.61m for investing into the business. Moreover, TPB has generated US$29.69m in operating cash flow over the same time period, resulting in an operating cash to total debt ratio of 14.70%, meaning that TPB’s operating cash is not sufficient to cover its debt. This ratio can also be interpreted as a measure of efficiency as an alternative to return on assets. In TPB’s case, it is able to generate 0.15x cash from its debt capital.
Can TPB pay its short-term liabilities?
With current liabilities at US$38.23m, it seems that the business has been able to meet these commitments with a current assets level of US$79.49m, leading to a 2.08x current account ratio. Usually, for Tobacco companies, this is a suitable ratio since there’s sufficient cash cushion without leaving too much capital idle or in low-earning investments.
Is TPB’s debt level acceptable?
With total debt exceeding equities, TPB is considered a highly levered company. This is not uncommon for a small-cap company given that debt tends to be lower-cost and at times, more accessible. No matter how high the company’s debt, if it can easily cover the interest payments, it’s considered to be efficient with its use of excess leverage. A company generating earnings after interest and tax at least three times its net interest payments is considered financially sound. In TPB’s case, the ratio of 3.3x suggests that interest is appropriately covered, which means that lenders may be inclined to lend more money to the company, as it is seen as safe in terms of payback.
Next Steps:
TPB’s debt and cash flow levels indicate room for improvement. Its cash flow coverage of less than a quarter of debt means that operating efficiency could be an issue. However, the company will be able to pay all of its upcoming liabilities from its current short-term assets. Keep in mind I haven’t considered other factors such as how TPB has been performing in the past. I recommend you continue to research Turning Point Brands to get a more holistic view of the stock by looking at:
Future Outlook: What are well-informed industry analysts predicting for TPB’s future growth? Take a look at our free research report of analyst consensus for TPB’s outlook.
Valuation: What is TPB worth today? Is the stock undervalued, even when its growth outlook is factored into its intrinsic value? The intrinsic value infographic in our free research report helps visualize whether TPB is currently mispriced by the market.
Other High-Performing Stocks: Are there other stocks that provide better prospects with proven track records? Explore our free list of these great stocks here.
To help readers see pass the short term volatility of the financial market, we aim to bring you a long-term focused research analysis purely driven by fundamental data. Note that our analysis does not factor in the latest price sensitive company announcements.
The author is an independent contributor and at the time of publication had no position in the stocks mentioned.
