What Type Of Shareholder Owns PolarityTE, Inc.'s (NASDAQ:PTE)?

Want to participate in a short research study? Help shape the future of investing tools and you could win a $250 gift card!
The big shareholder groups in PolarityTE, Inc. (NASDAQ:PTE) have power over the company. Institutions will often hold stock in bigger companies, and we expect to see insiders owning a noticeable percentage of the smaller ones. I quite like to see at least a little bit of insider ownership. As Charlie Munger said 'Show me the incentive and I will show you the outcome.'
PolarityTE is a smaller company with a market capitalization of US$146m, so it may still be flying under the radar of many institutional investors. Our analysis of the ownership of the company, below, shows that institutions are noticeable on the share registry. Let's delve deeper into each type of owner, to discover more about PTE.
View our latest analysis for PolarityTE
What Does The Institutional Ownership Tell Us About PolarityTE?
Institutional investors commonly compare their own returns to the returns of a commonly followed index. So they generally do consider buying larger companies that are included in the relevant benchmark index.
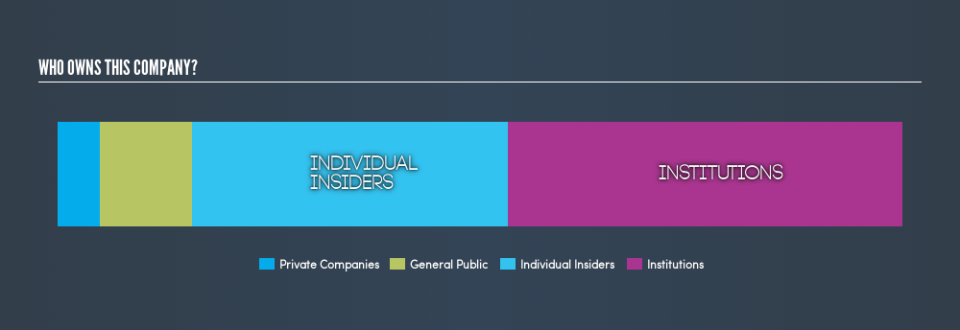
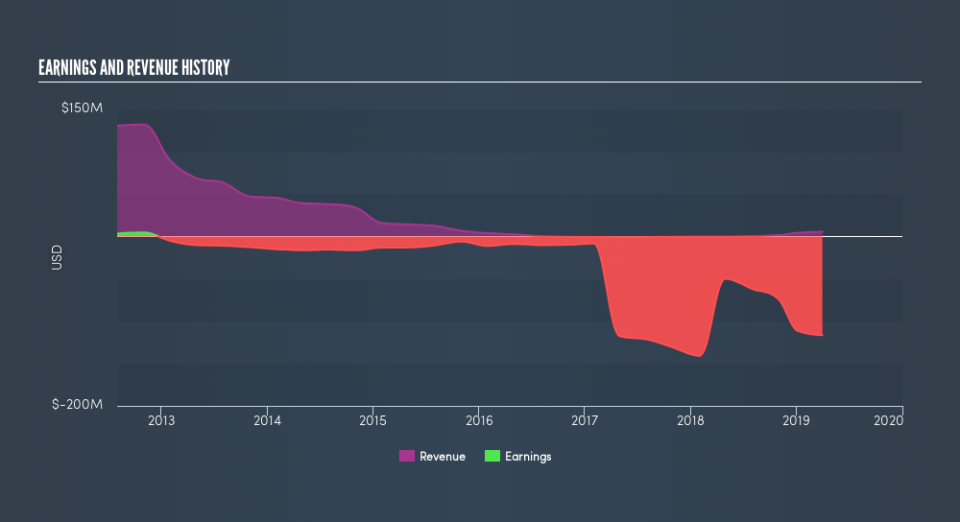
PolarityTE already has institutions on the share registry. Indeed, they own 47% of the company. This implies the analysts working for those institutions have looked at the stock and they like it. But just like anyone else, they could be wrong. When multiple institutions own a stock, there's always a risk that they are in a 'crowded trade'. When such a trade goes wrong, multiple parties may compete to sell stock fast. This risk is higher in a company without a history of growth. You can see PolarityTE's historic earnings and revenue, below, but keep in mind there's always more to the story.
PolarityTE is not owned by hedge funds. There are plenty of analysts covering the stock, so it might be worth seeing what they are forecasting, too.
Insider Ownership Of PolarityTE
While the precise definition of an insider can be subjective, almost everyone considers board members to be insiders. The company management answer to the board; and the latter should represent the interests of shareholders. Notably, sometimes top-level managers are on the board, themselves.
Insider ownership is positive when it signals leadership are thinking like the true owners of the company. However, high insider ownership can also give immense power to a small group within the company. This can be negative in some circumstances.
Our most recent data indicates that insiders own a reasonable proportion of PolarityTE, Inc.. It has a market capitalization of just US$146m, and insiders have US$55m worth of shares in their own names. It is great to see insiders so invested in the business. It might be worth checking if those insiders have been buying recently.
General Public Ownership
With a 11% ownership, the general public have some degree of sway over PTE. This size of ownership, while considerable, may not be enough to change company policy if the decision is not in sync with other large shareholders.
Private Company Ownership
Our data indicates that Private Companies hold 5.1%, of the company's shares. It might be worth looking deeper into this. If related parties, such as insiders, have an interest in one of these private companies, that should be disclosed in the annual report. Private companies may also have a strategic interest in the company.
Next Steps:
It's always worth thinking about the different groups who own shares in a company. But to understand PolarityTE better, we need to consider many other factors.
I like to dive deeper into how a company has performed in the past. You can access this interactive graph of past earnings, revenue and cash flow, for free .
Ultimately the future is most important. You can access this free report on analyst forecasts for the company.
NB: Figures in this article are calculated using data from the last twelve months, which refer to the 12-month period ending on the last date of the month the financial statement is dated. This may not be consistent with full year annual report figures.
We aim to bring you long-term focused research analysis driven by fundamental data. Note that our analysis may not factor in the latest price-sensitive company announcements or qualitative material.
If you spot an error that warrants correction, please contact the editor at editorial-team@simplywallst.com. This article by Simply Wall St is general in nature. It does not constitute a recommendation to buy or sell any stock, and does not take account of your objectives, or your financial situation. Simply Wall St has no position in the stocks mentioned. Thank you for reading.
