U.S. Dollar Index (DX) Futures Technical Analysis – Weakens Under 91.555, Strengthens Over 91.870
The U.S. Dollar is trading slightly better against a basket of major currencies early Monday. However, the greenback is still holding very close to a one-month low hit last week. Furthermore, Treasury yields, the main driver of the dollar, are hovering just above their lowest levels in five weeks.
Continuing to keep a lid on yields and the greenback is the dovish Federal Reserve monetary policy. Even with U.S. Consumer Inflation and Retail Sales coming in well-above expectations, and weekly initial claims hitting a level not seen since last year, Federal Reserve officials reiterated last week its view that any spike in inflation was likely to be temporary.
At 04:12 GMT, June U.S. Dollar Index futures are trading 91.660, up 0.116 or +0.13%.
Last week’s steep sell-off marked the second straight weekly loss for the dollar index and indicated that investors have accepted the Fed’s conclusion that the expected surge in inflation is likely to be transitory.
Daily Swing Chart Technical Analysis
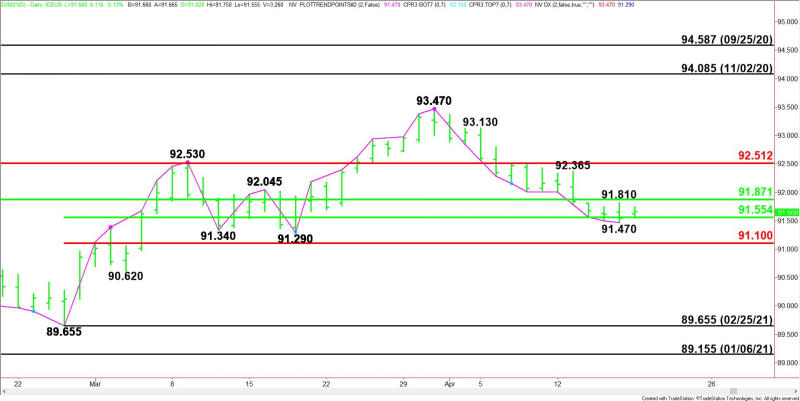
The main trend is up according to the daily swing chart, however, momentum has been trending lower since the formation of the closing price reversal top on March 31.
A trade through 91.290 will change the main trend to down, while a move through 93.470 will signal a resumption of the uptrend. Due to the prolonged move down in price and time, the market is susceptible to a closing price reversal bottom. If confirmed, this could trigger a 2 to 3 day counter-momentum rally.
The minor trend is also down. A trade through 91.810 will change the minor trend to up. This will also shift momentum to the upside.
The short-term range is 89.655 to 93.470. The index is currently testing its retracement zone at 91.555 to 91.100.
The main range is 94.590 to 89.155. Its retracement zone at 91.870 to 92.510 is potential resistance. This zone is also controlling the near-term direction of the index.
Daily Swing Chart Technical Forecast
The direction of the June U.S. Dollar Index on Monday is likely to be determined by trader reaction to the short-term 50% level at 91.555.
Bullish Scenario
A sustained move over 91.555 will indicate the presence of buyers. The first upside target is 91.810, followed closely by 91.870. Sellers could come in on the first test of this level, but taking it out could trigger an acceleration into 92.365 to 92.510.
Bearish Scenario
A sustained move under 91.555 will signal the presence of sellers. Taking out 91.470 could trigger a break into the main bottom at 91.290, followed closely by the Fibonacci level at 91.100. This is a potential trigger point for an acceleration to the downside with 90.620 the next target.
For a look at all of today’s economic events, check out our economic calendar.
This article was originally posted on FX Empire
