U.S. Dollar Index (DX) Futures Technical Analysis – BOJ Policy Decision Could Set Friday’s Early Tone
The U.S. Dollar closed sharply lower against a basket of major currencies on Thursday as traders continued to digest the impact of the Federal Reserve’s decision to hike interest rates by 75 basis points on Wednesday. The price action suggests that traders may believe the Fed is trying to cause a recession in order to slow down the economy and gain control over inflation.
The greenback was also pressured by strong rallies in the British Pound and Swiss Franc after the Bank of England (BOE) and the Swiss National Bank (SNB) hiked their interest rates as well to combat inflation.
On Thursday, the September U.S. Dollar Index settled at 103.417, down 1.518 or -1.46%. The Invesco DB US Dollar Index Bullish Fund ETF (UUP) finished at $27.67, down $0.27 or -0.97%.
Following the Fed’s widely expected three-quarters of a point interest rate hike, the SNB unexpectedly raised interest rates for the first time in 14 years.
The BOE also announced another 25 basis point rate hike, its fifth in a row. The BOE’s Monetary Policy Committee voted 6-3 to raise the bank rate to 1.25%, the highest rate in 13 years.
All eyes are now on the Bank of Japan (BOJ) which will make its monetary policy and interest rate decisions early Friday. Some aggressive speculators are betting officials may finally agree to tighten policy.
Daily Swing Chart Technical Analysis
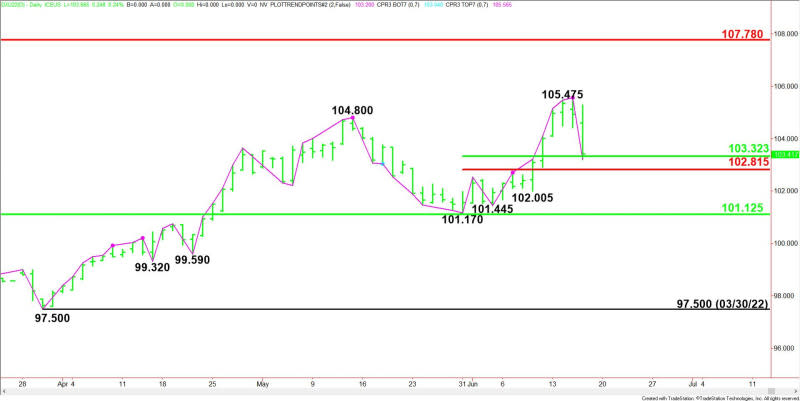
The main trend is up according to the daily swing chart, however, momentum is trending lower following the confirmation of Wednesday’s closing price reversal top.
A trade through 105.475 will negate the closing price reversal top and signal a resumption of the uptrend. A move through the main bottom at 101.445 will change the trend to down.
The minor trend is also up. A trade through 102.005 will change the minor trend to down. This will confirm the shift in momentum.
The short-term range is 101.170 to 105.475. On Thursday, traders tested its retracement zone at 103.320 to 102.815.
The major resistance is a long-term Fibonacci level at 107.780. The major support is a long-term 50% level at 101.125.
Daily Swing Chart Technical Forecast
Trader reaction to the short-term 50% level at 103.325 is likely to determine the direction of the September U.S. Dollar Index early Friday.
Bullish Scenario
A sustained move over 103.325 will indicate the presence of buyers. If this creates enough upside momentum then look for a possible surge into a minor pivot at 104.400. Overcoming this level could trigger a surge into the main top at 105.475.
Bearish Scenario
A sustained move under 103.320 will signal the presence of sellers. This could trigger a break into the short-term Fibonacci level at 102.815. A failure to hold this level could trigger a break into the minor bottom at 102.005.
A trade through 102.005 will shift momentum to the downside. This could lead to a test of the support cluster at 101.170 – 101.125.
For a look at all of today’s economic events, check out our economic calendar.
This article was originally posted on FX Empire
More From FXEMPIRE:
London’s Gatwick caps summer flight numbers over staff shortages
S.Korea’s Yoon calls for coordinated U.N. response to N.Korea’s provocations -media
Crypto Market Daily Highlights – June 16 – ETH and SOL Tumble
China’s Xi to host virtual BRICS leaders summit on June 23 – Xinhua
Yen tumbles from two-week high into BOJ decision, dollar bounces
