U.S. ECONOMY TO SHRINK 24% FROM APRIL to JUNE 2020: Goldman Sachs

This post originally appeared on The Basis Point: U.S. ECONOMY TO SHRINK 24% FROM APRIL to JUNE 2020: Goldman Sachs
Just four days ago, Goldman Sachs’ economics team said the U.S. economy (measured by GDP) would drop 5% in Q2. Yesterday Bank of America’s economics team said the economy would drop 12%. Today Goldman revised their estimate to say the economy would drop 24% in Q2 alone, then the rest of the year for annualized GDP estimates look like this:
Q1: -6%
Q2: -24%
Q3: +12%
Q4: +10%
2020: -3.1%
A recession is traditionally defined as negative GDP for 2 consecutive quarters. This qualifies given the prediction of a 6% drop in Q1 plus the gut wrenching drop of 24% for Q2.
GDP of -24% for a single quarter far dwarfs the sum of any multi-quarter declines in modern economic history, including post 2008 financial crisis years.
So even though Goldman predicts a huge bounce from -24% in Q2 to +12 in Q3, the Q2 number alone is eye-popping. If it plays out anywhere near this, it’ll be a very painful period for millions of Americans.
Below are details from Goldman, including employment predictions.
+++
GOLDMAN SACHS
U.S. DAILY – A SUDDEN STOP FOR THE U.S. ECONOMY
Over the last few days social distancing measures have shut down normal life in much of the US. News reports point to a sudden surge in layoffs and a collapse in spending, both historic in size and speed, as well as shutdowns of many schools, stores, offices, manufacturing plants, and construction sites. These developments argue for a much sharper drop in GDP in Q1 and Q2.
We expect declines in services consumption, manufacturing activity, and building investment to lower the level of GDP in April by nearly 10%, a drag that we expect to fade only gradually in later months. We now forecast quarter-on-quarter annualized growth rates of -6% in Q1, -24% in Q2, +12% in Q3, and +10% in Q4, leaving full-year growth at -3.8% on an annual average basis and -3.1% on a Q4/Q4 basis.
These downgrades to our growth forecasts imply a large upward revision to our unemployment rate forecast. Using three approaches—the empirical relationship between GDP and unemployment, the experience of Hurricane Katrina, and a bottom-up analysis of likely job losses by sector and occupation—we estimate a 5.5pp increase in the U3 unemployment rate to a 9% peak in coming quarters. However, we have more confidence that a large increase will be apparent in the U5 rate—which includes individuals who want a job but aren’t actively looking—than in the standard U3 rate.
A Sudden Stop for The U.S. Economy
Over the last few days social distancing measures have shut down normal life in much of the US. News reports point to a sudden surge in layoffs and a collapse in spending, both of which appear to be historic in size and speed. We are therefore making further large downward revisions to our economic forecast.
Using very timely high-frequency spending indicators as well as anecdotes about revenue declines from press reports, we have further revised our projections of spending declines in services categories that require face-to-face interaction. The bottom of Exhibit 1 shows our current assumptions—for example, we assume an 85% decline in sports and entertainment spending, a 75% decline in transportation spending, and a 65% decline in hotel and restaurant spending. The bars in the exhibit multiply these assumed cutbacks by the GDP share of each category to estimate the impact on the level of GDP.[1]
We have also revised our projections to assume that consumption will decline by the full amount shown in Exhibit 1 in the entire US during the second half of March and throughout April rather than a partial decline in just a fraction of the country, as we previously assumed.

In addition to the larger hit to services consumption, there are two other reasons for downgrading our growth forecast.
First, manufacturing activity now appears likely to contract more sharply than we had previously expected. Evidence of a deterioration in the manufacturing sector already appeared in the February hard data, and the plummeting Empire and Philly manufacturing surveys point to a further decline in March. In addition, where we had previously modeled the hit to manufacturing as a matter of supply chain disruptions, the decision by the biggest automakers to close their factories means we also need to allow for plant shutdowns due to worker fears about the virus. We now assume a peak 20% decline in the level of manufacturing output by April. This effect captures the impact of reduced domestic demand for non-food goods, reduced foreign demand for US goods exports, supply chain disruptions, and plant closures.
Second, weakness in high-frequency housing data in Asian countries hit earlier by the virus, reports of nationwide cancellations of open houses, and the shutdown of construction projects in some parts of the US suggest a large hit to the real estate and construction sector. We now assume 50% declines in the levels of brokers’ commissions and spending on home improvement and 25% declines in the levels of homebuilding and business structures investment in April.
In total, we expect declines in services consumption, manufacturing activity, and building investment to lower the level of GDP in April by nearly 10%. We assume that this drag then fades gradually by 10% each month. While the exact timing is highly uncertain and relapses are plausible, the assumption of a gradual recovery reflects the potential contributions from factors such as effective mitigation and testing actions, weather effects, medical breakthroughs or adaptation by firms and consumers. The slow pace of recovery even in 2021 allows for longer-lasting scarring effects on businesses and workers.
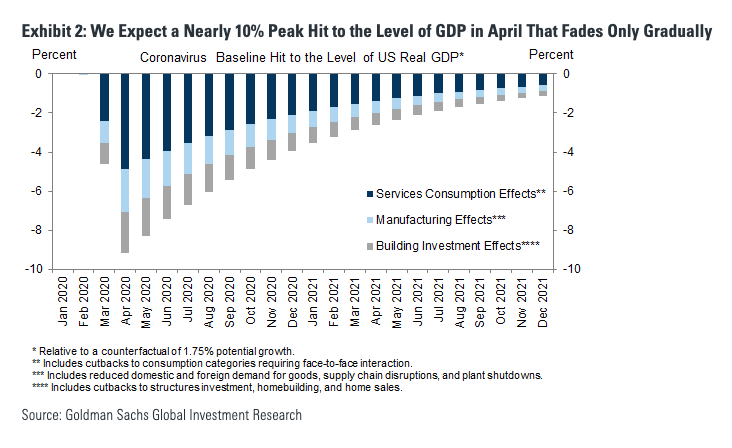
Exhibit 3 translates the monthly path of the level of GDP shown in Exhibit 2 into a quarterly path of GDP growth, adding the impact of the fiscal impulse. We have downgraded our tracking estimate for 2020Q1 to -6% (from -0.2% previously). The largest change to our forecast is in 2020Q2, where we are now forecasting a -24% quarterly annualized growth pace (from -5% previously). A decline of this magnitude would be nearly two-and-a-half times the size of the largest quarterly decline in the history of the modern GDP statistics (-10% quarterly annualized in 1958Q1). It would mean that in only one quarter, the economy would experience an increase in the output gap bigger than that experienced in the entirety of every postwar US recession.
Our assumptions about the gradual fading of the virus drag imply a growth pace of +12% in 2020Q3, +10% in 2020Q4, and +8%/+6%/+4%/+3% in 2021Q1-Q4. Our forecast of full-year growth is now -3.8% on an annual average basis and -3.1% on a Q4/Q4 basis.
Why such an extreme forecast, especially in Q2? The sudden stop in US economic activity in response to the virus is unprecedented, and the early data points over the last week strengthen our confidence that a dramatic slowdown is indeed already underway. In some US states, authorities have now issued statewide shutdown orders to slow the pace of virus spread and avoid overwhelming the health care system, measures that will further reduce the level of economic activity.
We caution, however, that our forecasts correspond to the final print of GDP growth once all of the data are in hand, and the first release of Q2 GDP growth is likely to be less negative—perhaps much less negative—than the revised data. The Quarterly Services Survey provides the source data for most of the services consumption categories shown in Exhibit 1, but is not available for the initial release. As a result, the initial print will depend in part on the assumptions that the national accounts statisticians make about not-yet-available data, and it is hard to know how negative their assumptions will be.
These sharp downgrades to our growth forecasts imply a large upward revision to our unemployment rate forecast. We consider three approaches to estimating the increase in the unemployment rate.
First, a simple Okun’s Law calculation implies an increase of almost 4pp from the nearly 8pp increase in the output gap by Q2. We might normally expect a smaller effect from a short-lived contraction because job losses tend to lag growth, but in this case a surge in job losses appears to be happening very quickly.
Second, we consider the experience of Hurricane Katrina, the modern natural disaster that had the largest impact on a regional US labor market. In the months after Katrina, the unemployment rate rose about 6pp in Louisiana and 10pp in the New Orleans area.
Third, we use a bottom-up analysis of likely job losses by sector and occupation—for example, sales workers in the retail trade industry or services workers in leisure and hospitality—an approach that mirrors our estimates of the consumption hit shown in Exhibit 1. Where possible, we try to link our assumptions to data points gleaned from press reports. This approach suggests a 6-7pp increase.
Putting some weight on each of these approaches, we forecast a 5.5pp increase in the unemployment rate over the next couple of quarters, taking it from 3.5% to 9%. A risk to our forecast is that the headline U3 unemployment rate could rise by less if shutdowns prevent workers from actively looking for work, a requirement to count as unemployed (though filling out an online job application counts). For example, during Hurricane Katrina, the BLS noted that some people in affected areas may not have been able to search for a job and would therefore not have been classified as unemployed. Moreover, some states have waived the requirement that unemployment insurance recipients search for work, adding to the risk that fewer workers will count in the U3 measure. As a result, we feel more confident that our forecasted 5.5pp increase will appear in the broader U5 rate, which includes marginally attached workers who want to work and are available, but did not search for work.
We see a couple of reasons that the unemployment rate is likely to rise by more than the usual Okun’s Law relationship suggests. The decline in GDP is likely to be concentrated in labor-intensive industries and is likely to disproportionately affect low-wage occupations prone to temporary layoffs. Moreover, the extremely abrupt disruption of cash flow facing many businesses is likely to force them to lay workers off immediately simply because they cannot afford to pay them, whereas in typical slowdowns businesses that are still profitable tend to reduce their workforce more gradually as revenues decline.
The details of the forthcoming fiscal stimulus package could push the unemployment rate in either direction. Unemployment insurance benefits have expanded modestly under Phase 2 of the fiscal package, which became law on March 17. We expect a more substantial expansion, including increased benefit payment amounts to cover a greater share of workers’ lost wages, to be included in Phase 3, which we expect to become law the week of March 23. Greater unemployment benefits might make it easier for employers to lay off workers they hope to rehire, knowing that they will receive a higher share of their former wages than employers can pay them.
In the other direction, the Senate Republican proposal for Phase 3 of the fiscal package includes funding for small business loans that would be forgiven if used to finance payroll from March to June, as long as firms pay workers at least 75% of their normal pay. The odds are increasing that such a provision will be enacted as part of Phase 3, but for now our best guess is that more generous unemployment insurance will be the stronger factor, so that on net these two policies are more likely to nudge the reported unemployment rate higher than lower.
DO YOU LIKE MONEY? GET MORE AT THE BASIS POINT®
Can 2021 Mortgage Market Thrive With $1 Trillion Less In Refis?
