Are ULS Technology plc’s (LON:ULS) Interest Costs Too High?

While small-cap stocks, such as ULS Technology plc (LON:ULS) with its market cap of UK£49m, are popular for their explosive growth, investors should also be aware of their balance sheet to judge whether the company can survive a downturn. Online Retail businesses operating in the environment facing headwinds from current disruption, even ones that are profitable, are inclined towards being higher risk. So, understanding the company’s financial health becomes vital. Here are few basic financial health checks you should consider before taking the plunge. Though, this commentary is still very high-level, so I’d encourage you to dig deeper yourself into ULS here.
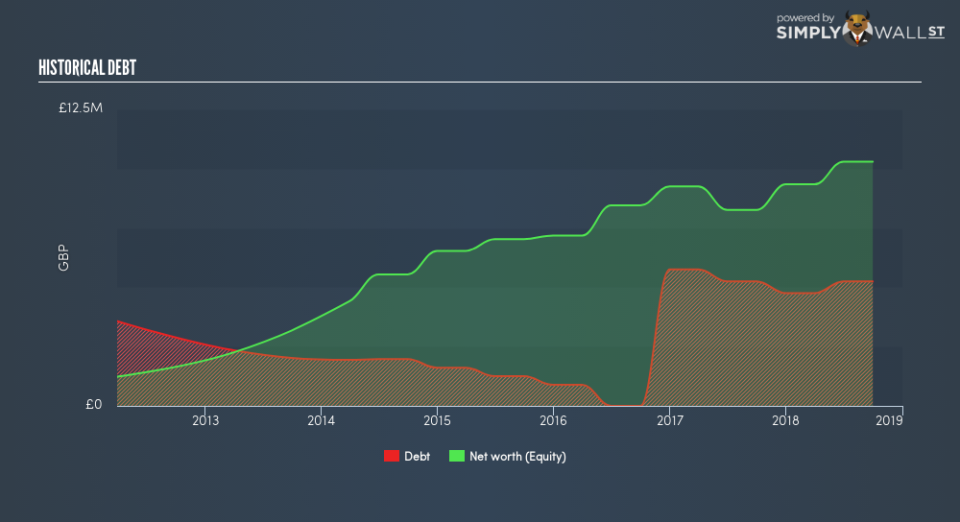
How does ULS’s operating cash flow stack up against its debt?
ULS has sustained its debt level by about UK£5.3m over the last 12 months including long-term debt. At this current level of debt, ULS currently has UK£1.8m remaining in cash and short-term investments , ready to deploy into the business. Additionally, ULS has produced UK£5.9m in operating cash flow in the last twelve months, leading to an operating cash to total debt ratio of 112%, meaning that ULS’s debt is appropriately covered by operating cash. This ratio can also be a sign of operational efficiency as an alternative to return on assets. In ULS’s case, it is able to generate 1.12x cash from its debt capital.
Can ULS pay its short-term liabilities?
With current liabilities at UK£9.7m, it seems that the business may not be able to easily meet these obligations given the level of current assets of UK£4.0m, with a current ratio of 0.41x.
Does ULS face the risk of succumbing to its debt-load?
With a debt-to-equity ratio of 51%, ULS can be considered as an above-average leveraged company. This is not uncommon for a small-cap company given that debt tends to be lower-cost and at times, more accessible. We can test if ULS’s debt levels are sustainable by measuring interest payments against earnings of a company. Ideally, earnings before interest and tax (EBIT) should cover net interest by at least three times. For ULS, the ratio of 44.54x suggests that interest is comfortably covered, which means that debtors may be willing to loan the company more money, giving ULS ample headroom to grow its debt facilities.
Next Steps:
Although ULS’s debt level is towards the higher end of the spectrum, its cash flow coverage seems adequate to meet debt obligations which means its debt is being efficiently utilised. However, its low liquidity raises concerns over whether current asset management practices are properly implemented for the small-cap. This is only a rough assessment of financial health, and I’m sure ULS has company-specific issues impacting its capital structure decisions. I recommend you continue to research ULS Technology to get a more holistic view of the stock by looking at:
Future Outlook: What are well-informed industry analysts predicting for ULS’s future growth? Take a look at our free research report of analyst consensus for ULS’s outlook.
Valuation: What is ULS worth today? Is the stock undervalued, even when its growth outlook is factored into its intrinsic value? The intrinsic value infographic in our free research report helps visualize whether ULS is currently mispriced by the market.
Other High-Performing Stocks: Are there other stocks that provide better prospects with proven track records? Explore our free list of these great stocks here.
To help readers see past the short term volatility of the financial market, we aim to bring you a long-term focused research analysis purely driven by fundamental data. Note that our analysis does not factor in the latest price-sensitive company announcements.
The author is an independent contributor and at the time of publication had no position in the stocks mentioned. For errors that warrant correction please contact the editor at editorial-team@simplywallst.com.
