
Understanding Business Cycles

By: Vintage Value Investing
Harvest Exchange
March 2, 2018
Understanding Business Cycles
This post is brought to you by Finbox.io. Sign up for your completely FREE trial today!
Business Cycles

Business cycles are fascinating. Driven by human nature, business cycles go through phases of expansion and contraction displaying similar patterns over and over again. In this post, we are going to explore the stages of a traditional business cycle and what to look out for at each phase.
There are five stages of the business cycle referred to as the recession, the trough, the recovery, the expansion and the peak. Just like it is hard to pinpoint the top and bottom of a market, it is extremely difficult to pinpoint the trough and peak of a business cycle. Instead of trying to focus on the extreme ends of the cycle, we are going to explore the typical happenings at the stages of recovery, expansion, and recession.

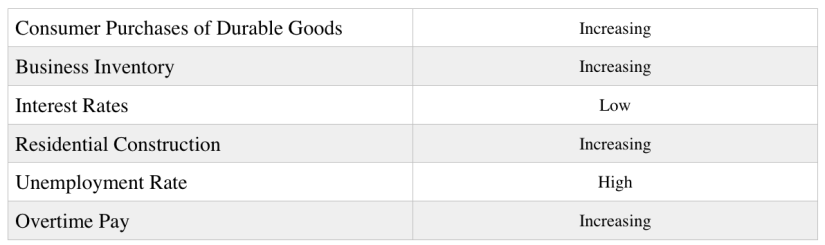
Recovery
To begin our tour of the business cycle let’s start with the recovery. The charge into the recovery phase is led by consumer purchases of durable goods. Consumers begin making purchases of durable goods that were primarily delayed during the previous recession. Sales of durable goods pick up quickly, giving businesses indication a turn in the economy is occurring. Companies focus on rebuilding inventory levels to meet demand and keep their inventory to sales ratio at a constant. Due to low interest rates, residential construction begins to take off. Although businesses are willing to invest heavily in inventory levels, their caution to the validity of the recovery leaves them hesitant to hire new employees. Firms match labor needs by paying overtime as it is a cheaper alternative than hiring new and permanent employees. For this reason, unemployment rates stay relatively consistent at high levels. Towards the later portion of a recovery demand in borrowing is in full force creating the need to raise interest rates.
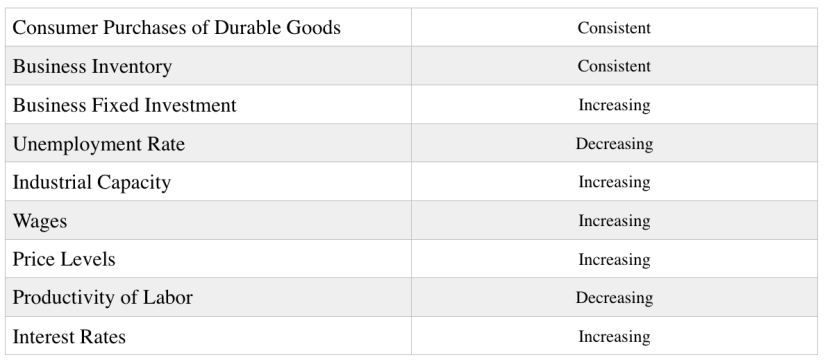
Expansion
Once a recovery meets full momentum, it blossoms into economic expansion. At this point, consumer purchases of durable goods slow from hyper-growth to reasonable levels as most postponed orders have been filled. Seeing sales stabilize, businesses voluntary investment in inventory declines to match demand. Confidence in the economy leads businesses to invest in plant and equipment. Overall business fixed investments rise rapidly during this phase. Firms have grown tired of paying expensive overtime, and with confidence, the good economy is here to stay they begin hiring more workers. Unemployment drops meaning more people are employed. As more people are employed, firms move closer to fulfilling their industrial capacity. As less workers are available to fill jobs, businesses raise wages to become more competitive among employers. More money to spend pushes general price levels up.
Towards the end of an expansion stage firms reach a point where the labor they added has diminishing returns. Less effective returns on labor translates to a decline in the marginal productivity of labor. Asset prices reach high levels compared to their historical cost of earnings. Sensing an overheating economy central banks raise interest rates. Higher interest rates make borrowing and available credit much more difficult to obtain.
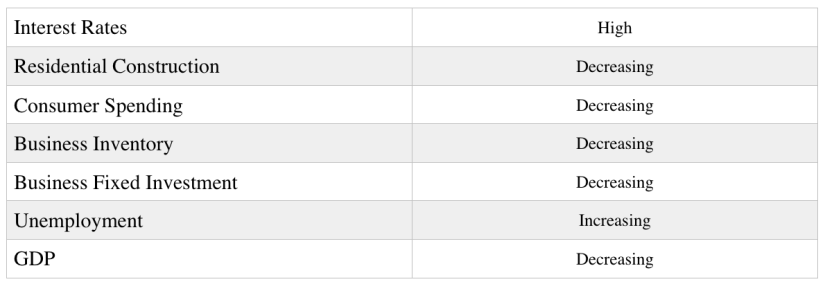
Recession
High interest rates take out residential construction first. Consumers can’t borrow and begin to pull back on purchases of homes and other durable goods. Businesses take notice of consumers reduced spending and decide to cut their inventory levels. Less in inventory means less need for production. Businesses no longer need to meet growth demands and pull back on fixed investments. As the recession lingers, firms stay afloat by laying off employees thus increasing the unemployment rate. Less money to spend leads to a dip in the GDP.
Each cycle is different incorporating new components that defy historical assumptions. However, the general theme is noticeable and easy to identify. One of the big reasons we don’t see identical business cycles is due to structural changes to the country.
Structural Changes in Business Cycles
Over the history of the United States, business cycles have evolved in response to the nations structural changes. As the concentration of employment shifted from manufacturers and other cyclical industries to less cyclically sensitive trades, the overall US economy became more resistant to fluctuations. Another trend that has shaped the volatility of business cycles is government spending. At the start of the 20th century, government spending was only 6.9% of overall GDP. Today the estimated government spending for 2018 will be 35.8% of overall GDP. Governments tend to be less cyclical then private industries and keep their spending (and employment) rather consistent during various stages of the business cycle.
Policy
Policy is another area that has shaped how business cycles play out. The United States has used various formats of policy to weather downturns in the economy. Some policies are automatic stabilizers that have existed for years. Other policies can be implemented at discretion when the time is needed.
Unemployment Act – Unemployment insurance is countercyclical. Payments flow outward at an increasing rate during recessions putting more funds in circulation. During good times, more people are employed leading to more taxes collected on worker earnings.
Agricultural Price Supports – Agricultural price supports were created as another counter-cyclical measure. When a downturn hits the economy, the safety net of prices on farm commodities kicks in making it still economically feasible to grow food.
Progressive Income Tax – As income levels drop, so do tax receivables. However, a progressive structure allows households to keep a larger percentage of their income compared to the decline in their income level. A progressive income tax is intended to keep more funds in the hands of individuals to reduce overall hardship. More income in the hands of individuals creates less dependency on the government and more funds to fuel the recovery.
Public Projects – Public projects have been used throughout the countries history to boost jobs when the private sector could not. A well thought out government works project will typically consist of producing useful infrastructure projects that private firms would find unprofitable. Creating these jobs pumps money back into the economy by employing individuals who would be absent from making an income.
Monetary Policy – Monetary policy consists of actions by the central bank. The central bank can print money and control interest rates to throttle or stimulate the economy depending on what they view as needed at the time.
Fiscal Policy – Fiscal policy refers to what the government spends and collects via taxes.
Finding The Data
Data to map out a business cycle is conveniently available through government sites. There are a few things to consider when looking at reported economic data. First, most of the reported data will have future revisions, meaning what you are looking at can vary at a later date. Adjustments and revisions typically occur because of delays in survey responses. Another consideration about economic data is the variance in which it is released. Some data is released monthly, while other data is released quarterly. Let’s dive into what indicators are available to map what is happening in the stages of the cycles we reviewed.
Durable Goods Orders
While most economic indicators report on what has happened, Durable Goods Orders project more of what will occur in the future. Over 3,500 manufacturers across 89 industries are surveyed to compile this indicator. If companies are receiving orders (defined by a legally binding agreement to purchase a product for immediate or future delivery), you can bet factories will stay open, people will remain employed, and the economic machine will keep moving forward. It is this reasoning as to why market sensitivity can be extremely high when this indicator is released.
Released: Monthly https://www.census.gov/manufacturing/m3/index.html 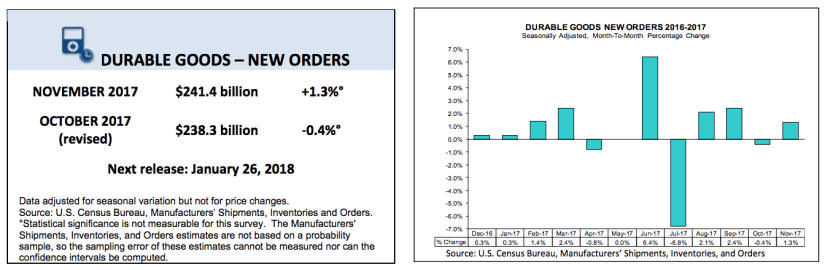
Business Inventory
Total Business Inventory represents the number of goods that manufacturers, retailers, and wholesalers keep in stock. An important factor is understanding the Inventory to Sales ratio (I/S). Each industry is different but generally speaking, a business wants to keep a healthy amount of inventory to service customer demand. The trick is to walk that line without leaving too much inventory unused that would result in a cashflow squeeze. Historically businesses have held on average 1.45 months worth of goods. When this number is below the 1.45 average and businesses are optimistic about the economy, firms boost inventory orders. As the I/S ratio exceeds the 1.45 average, businesses will ease off inventory orders until demand picks back up.
Released: Monthly https://www.census.gov/mtis/index.html 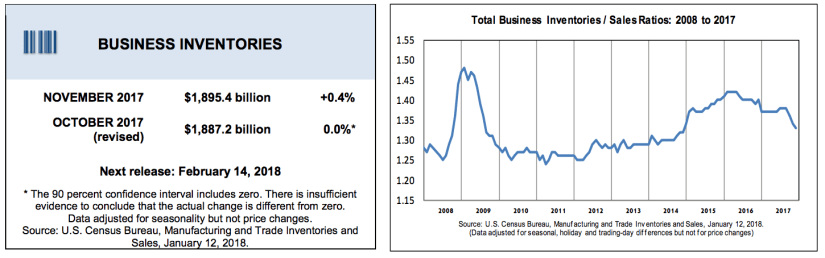
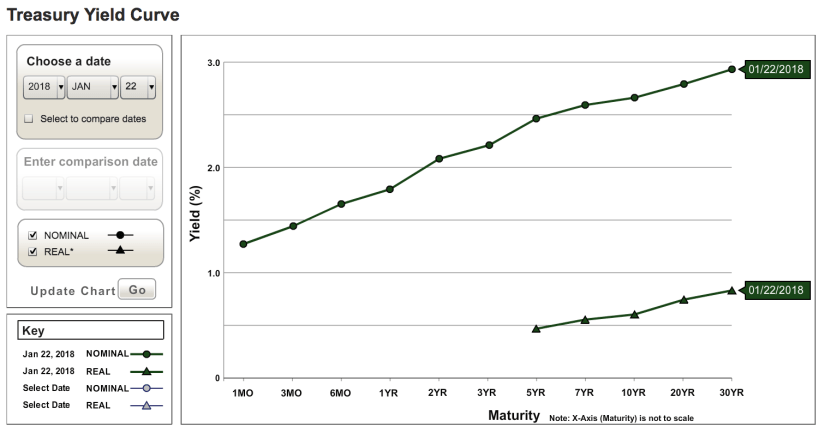
Interest Rates
Interest rates are available all the time and are very much worth monitoring. There are three particular components of interest rates that you should keep an eye on.
10 Year Yield – The 10 year yield is one of the most important numbers in finance for the mere reason that essentially all interest rates are set with a premium adjustment to this number. Everything from car loans, to mortgages, to student loans and credit cards can be related back to the 10 year yield.
10 Year Minus 3 Month Yield – The spread between the 10 year and the 3 month can serve as a good indicator as to the possibility of a slowdown in the economy. As short term interest rates rise, the spread between the longterm and short-term narrows. Historically as it moves into negative territory the likely hood of a recession increases.

Overall Yield Curve – An inverted yield curve is notorious for showing up around a recession. It’s not always the case but more likely the rule than the exception. Short-term interest rates have fully risen above long-term interest rates creating the inverted shape.
Residential Construction
To monitor residential construction, the Census Bureau tracks two individual numbers, building permits, and housing starts. Housing starts follow how many new residential real estate projects broke ground the previous month. Building permits are required in over 95% of US localities giving a proper interpretation of future construction. Housing has a very strong multiplier effect throughout the economy. As residential construction increases, so does the need for steel, wood, electricity, glass, plastic, wiring, piping and concrete. Housing construction also increases jobs, creating an estimated 2.5 full-time jobs for every one house under construction. Once a home is complete, the need for furniture, carpet, electronics, and appliances all drive sales in those sectors of the economy.
Released: Monthly https://www.census.gov/construction/nrc/index.html 
Unemployment Rate
Unemployment is perhaps one of the most important indicators of the economy. More jobs lead the way to more spending and more income to the government via taxes. It is a straightforward indicator that is popularly covered and discussed.
Released: Monthly https://stats.bls.gov/news.release/empsit.toc.htm 
Overtime Pay
To find overtime pay, you will need to monitor the Employer Cost For Employee Compensation index compiled by the Bureau of Labor Statistics. Within this report, you will see a category for Supplemental Pay. Under that group, you can find a specific metric titled “Overtime and Premium.” Overtime and Premium pay gives you an indication as to the overall cost breakdown of overtime.
Released: Quarterly https://www.bls.gov/news.release/ecec.toc.htm 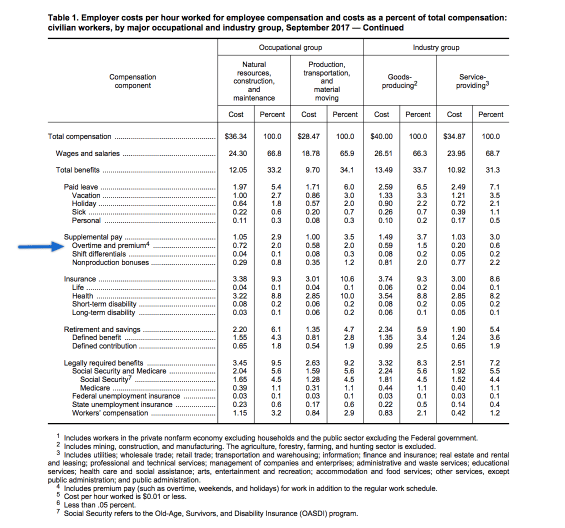
Business Fixed Investment
To monitor business fixed investment, you will want to use the “Net Domestic Investment: Private: Domestic Business index.” This index is very specific focusing on capital investment in tangible assets such as buildings, machinery, equipment, and vehicles within the US and by private firms only.
Released: Quarterly https://fred.stlouisfed.org/series/W790RC1Q027SBEA 
Industrial Capacity
Industrial capacity is an extremely difficult metric to compile accurately. The ability to pinpoint the exact amount an industry can produce (known as available capacity) can be quite difficult because firms are growing and shrinking on an ongoing basis. Regardless, this indicator will give you a rough idea of what capacity the economy is producing compared to its hypothetical capabilities.
Released: Monthly https://fred.stlouisfed.org/series/TCU 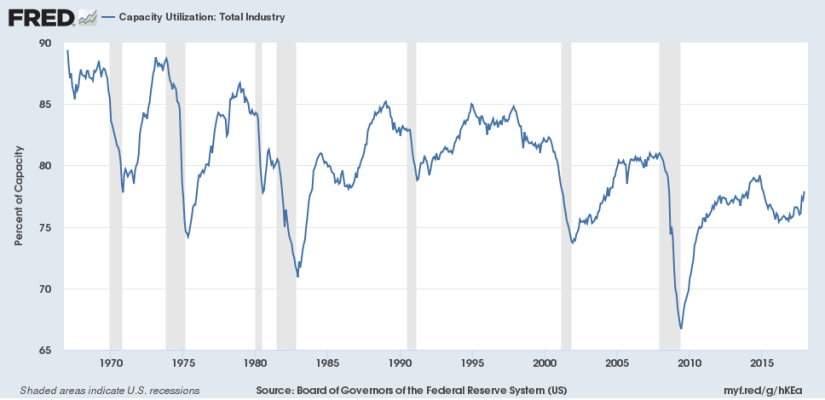
Wages
Wages can be found on the Employer Costs For Employee Compensation report that was also used for monitoring overtime pay. The difference in your analysis this time is monitoring total wages and salaries as opposed to just the component of overtime and premium pay.
Released: Monthly https://www.bls.gov/news.release/ecec.toc.htm 
Price Levels
Price levels are monitored via the Consumer Price Index (CPI). This indicator is highly important as it indicates inflation levels. Inflation effects investments, labor costs, fiscal policy and other dynamics that drive the economy.
Released: Monthly https://www.bls.gov/cpi/ 
Productivity of Labor
Productivity is the most powerful force behind an economy. An increased level of productivity allows the economy to grow without inflation and ultimately generates a higher return on allocated resources.
Released: Quarterly https://www.bls.gov/lpc/#news 
Overall, a good understanding of business cycles will help you cast realistic expectations for specific investments. If you are entering a position in hopes of capturing short term growth, check where things are in the business cycle. If you are gauging the performance of management to peers, check how they performed in various stages of the business cycle. If you are trying to decide if you should abandon an investment because of underperformance, check to see if it’s the business cycle that is creating the lag. It is a fun, worthwhile exercise that pays nicely.
Sources
Su, V. (1996). Economic fluctuations and forecasting. New York: HarperCollins.
Baumohl, B. (2005). The secrets of economic indicators: hidden clues to future economic trends and investment opportunities. Upper Saddle River, NJ: Wharton School Pub.
Picerno, J. (2014). Nowcasting the business cycle: a practical guide for spotting business cycle peaks ahead of the crowd. United States: Beta Publishing.
Author: Carter Johnson
Expertise: Entrepreneurship and business strategy
Carter is the founder of United Business Leaders which invests in private companies with strong operating histories. He has a passion for investing and helping businesses with strategic initiatives.
Connect with Carter on LinkedIn.

image source: media-sense
Read more awesome articles like this one on VintageValueInvesting.com!
Read more great articles at Vintage Value Investing.

RSS Import: Original Source
Originally Published at: Understanding Business Cycles
