Union Pacific (NYSE:UNP) Seems To Use Debt Quite Sensibly

Warren Buffett famously said, 'Volatility is far from synonymous with risk.' So it seems the smart money knows that debt - which is usually involved in bankruptcies - is a very important factor, when you assess how risky a company is. We note that Union Pacific Corporation (NYSE:UNP) does have debt on its balance sheet. But is this debt a concern to shareholders?
What Risk Does Debt Bring?
Debt and other liabilities become risky for a business when it cannot easily fulfill those obligations, either with free cash flow or by raising capital at an attractive price. In the worst case scenario, a company can go bankrupt if it cannot pay its creditors. However, a more usual (but still expensive) situation is where a company must dilute shareholders at a cheap share price simply to get debt under control. Having said that, the most common situation is where a company manages its debt reasonably well - and to its own advantage. The first thing to do when considering how much debt a business uses is to look at its cash and debt together.
View our latest analysis for Union Pacific
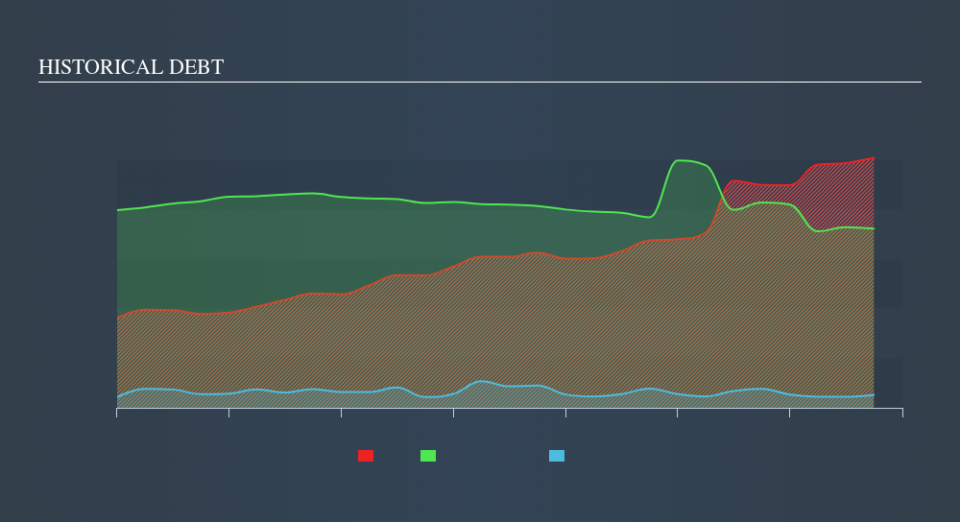
What Is Union Pacific's Debt?
You can click the graphic below for the historical numbers, but it shows that as of September 2019 Union Pacific had US$25.1b of debt, an increase on US$22.4b, over one year. However, because it has a cash reserve of US$1.31b, its net debt is less, at about US$23.8b.
How Strong Is Union Pacific's Balance Sheet?
Zooming in on the latest balance sheet data, we can see that Union Pacific had liabilities of US$4.59b due within 12 months and liabilities of US$39.4b due beyond that. Offsetting these obligations, it had cash of US$1.31b as well as receivables valued at US$1.65b due within 12 months. So its liabilities outweigh the sum of its cash and (near-term) receivables by US$41.0b.
While this might seem like a lot, it is not so bad since Union Pacific has a huge market capitalization of US$121.9b, and so it could probably strengthen its balance sheet by raising capital if it needed to. But it's clear that we should definitely closely examine whether it can manage its debt without dilution.
In order to size up a company's debt relative to its earnings, we calculate its net debt divided by its earnings before interest, tax, depreciation, and amortization (EBITDA) and its earnings before interest and tax (EBIT) divided by its interest expense (its interest cover). Thus we consider debt relative to earnings both with and without depreciation and amortization expenses.
With a debt to EBITDA ratio of 2.2, Union Pacific uses debt artfully but responsibly. And the fact that its trailing twelve months of EBIT was 8.9 times its interest expenses harmonizes with that theme. Notably Union Pacific's EBIT was pretty flat over the last year. We would prefer to see some earnings growth, because that always helps diminish debt. There's no doubt that we learn most about debt from the balance sheet. But it is future earnings, more than anything, that will determine Union Pacific's ability to maintain a healthy balance sheet going forward. So if you want to see what the professionals think, you might find this free report on analyst profit forecasts to be interesting.
Finally, a company can only pay off debt with cold hard cash, not accounting profits. So the logical step is to look at the proportion of that EBIT that is matched by actual free cash flow. Over the most recent three years, Union Pacific recorded free cash flow worth 56% of its EBIT, which is around normal, given free cash flow excludes interest and tax. This cold hard cash means it can reduce its debt when it wants to.
Our View
Union Pacific's interest cover was a real positive on this analysis, as was its conversion of EBIT to free cash flow. On the other hand, its net debt to EBITDA makes us a little less comfortable about its debt. Considering this range of data points, we think Union Pacific is in a good position to manage its debt levels. Having said that, the load is sufficiently heavy that we would recommend any shareholders keep a close eye on it. Above most other metrics, we think its important to track how fast earnings per share is growing, if at all. If you've also come to that realization, you're in luck, because today you can view this interactive graph of Union Pacific's earnings per share history for free.
Of course, if you're the type of investor who prefers buying stocks without the burden of debt, then don't hesitate to discover our exclusive list of net cash growth stocks, today.
We aim to bring you long-term focused research analysis driven by fundamental data. Note that our analysis may not factor in the latest price-sensitive company announcements or qualitative material.
If you spot an error that warrants correction, please contact the editor at editorial-team@simplywallst.com. This article by Simply Wall St is general in nature. It does not constitute a recommendation to buy or sell any stock, and does not take account of your objectives, or your financial situation. Simply Wall St has no position in the stocks mentioned. Thank you for reading.
