US Debt Deal Looks Close - AUD/JPY and S&P 500 Offer Clues
Talking Points:
- Day eleven of the US government shutdown and a short-term deal (approximately six-weeks) is said to be in the works.
- US debt limit hit on October 17 (6 days).
- US Advance Retail Sales off the calendar due to government shutdown; US U. of Michigan Confidence remains.
To receive this report in your inbox every morning, sign up for Christopher’s distribution list.
INTRADAY PERFORMANCE UPDATE: 09:45 GMT
Dow Jones FXCM Dollar Index (Ticker: USDOLLAR): +0.13% (+0.29%prior 5-days)
ASIA/EUROPE FOREX NEWS WRAP
Even though Democrats led by the White House rejected House Republicans' plans to raise the debt limit for six-weeks (there was no provision to reopen the government), investors have happily noted the shift in negotiating parlance by diving head first back into riskier asset pools. The Australian and New Zealand Dollars, which bended but didn’t break this week, are leaders alongside the Euro, which remains supported by its own shifting sentiment thanks to the European Central Bank.
So as markets perhaps front-run the six-week debt limit extension news – US 1-month generic T-bill yields have slid, as have yields of bills due in the second-half of October, while debt redeemable six-weeks out has started to see price decline/yields increase (when the supposed debt limit extension would end) – equity markets around the globe are looking through the negotiating period and instead tuning into the fact that the US government shutdown has now likely precipitated a further non-taper by the Federal Reserve at its October policy meeting.
US fiscal headlines will continue to rattle markets and there of course remains the seemingly diminishing possibility that no deal emerges. For the time being, it seems that markets are discounting such a scenario entirely. Two charts suggest to me that “risk” is shifting back “on.” First, the AUDJPY:
AUDJPY 8-hour Chart: September 27 to October 11, 2013
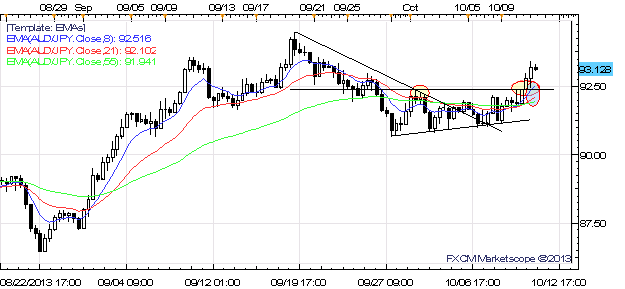
On the H8 chart, price has closed above ¥92.38, former swing resistance in the downtrend from the September highs, and resistance this past week briefly. Furthermore, the 8-/21-/55-EMA structure on short-term timeframes through H8 show full bullish continuity (ST > MT > LT); momentum is turning higher for the “carry trade.”
The next chart is the fair value S&P 500 futures contract, which as the headline barometer of risk for US assets is showing signs of a bullish breakout:
SPX500 Daily Chart: June 18 to October 11, 2013
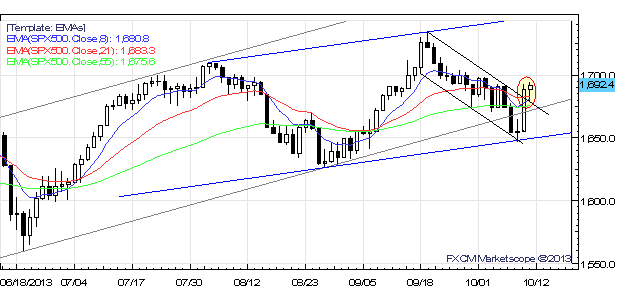
The day after the Federal Reserve’s non-QE3 taper the S&P 500 topped, and has since then traded in a descending channel (black descending channel on chart) that nearly saw major support break: the uptrend that has guided price since November 2012 (with prior tests of support coming in December 2012, June 2013, and August 2013) (grey ascending channel on chart).
Although price closed below this channel support for two consecutive days, a Doji on the second day close suggested a potential pause in selling. Furthermore, the Doji appeared at a short-term channel support, the parallel taken from the August 2 and September 19 highs measured to the August 28 low (blue ascending channel on chart).
Between yesterday and thus far today, two events have developed in the S&P 500 futures contract: the descending channel from the September 19 high broke amid a bullish candlestick cluster on the daily chart (Morning Star); price has retaken the year-long ascending channel as the EMAs have shifted higher (momentum becoming more bullish).
If FX markets and equity market futures are offering signs in the wake of the US fiscal negotiations, it’s that investors are gearing for a risk-positive landscape as short-term bullish technical breakouts form in “risky” asset classes. In context of the news, diminished US fiscal risks and prolonged easy monetary policy from the Fed would support improved risk appetite.
Read more: Demand for Safety Falls as Yellen Nomination Overshadows Budget Impasse
ECONOMIC CALENDAR – UPCOMING NORTH AMERICAN SESSION

See the DailyFX Economic Calendar for a full list, timetable, and consensus forecasts for upcoming economic indicators. Want the forecasts to appear right on your charts? Download the DailyFX News App.
--- Written by Christopher Vecchio, Currency Analyst
To contact Christopher Vecchio, e-mail cvecchio@dailyfx.com
Follow him on Twitter at @CVecchioFX
To be added to Christopher’s e-mail distribution list, please fill out this form
DailyFX provides forex news and technical analysis on the trends that influence the global currency markets.
Learn forex trading with a free practice account and trading charts from FXCM.
