US Dollar Bottom Comfirmation Pending, SPX 500 Eyeing 1900 Anew
Talking Points:
US Dollar: Double Bottom Setup Confirmation Pending
S&P 500 Surges to Test Record High Below 1900 Mark
Gold, Crude Oil Prices Locked in Consolidation Mode
Can’t access to the Dow Jones FXCM US Dollar Index? Try the USD basket on Mirror Trader. **
US DOLLAR TECHNICAL ANALYSIS – Prices may be in the process of setting a double bottom at 10375, the October 22 close. Initial confirmation requires a breach of resistance is at 10469, marked by the top of a falling channel that has guided the greenback lower since the beginning of the year. A daily close above this barrier initially targets horizontal support-turned-resistance at 10495.
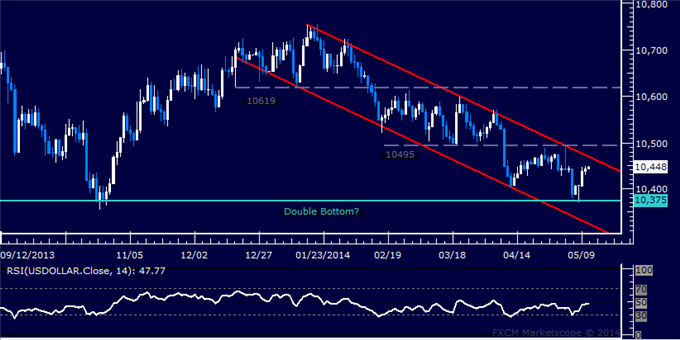
Daily Chart - Created Using FXCM Marketscope 2.0
** The Dow Jones FXCM US Dollar Index and the Mirror Trader USD basket are not the same product.
S&P 500 TECHNICAL ANALYSIS – Prices rebounded as expected after putting in a Piercing Line candlestick pattern. The index launched higher to test resistance in the 1898.90-99.10 area marked by the 61.8% Fibonacci expansion and the April 4 high. A break above this barrier on a daily closing basis exposes the 76.4% level at 1910.50. Alternatively, a reversal below support at 1889.60, the 50% Fib, targets the 38.2% expansion at 1880.30.
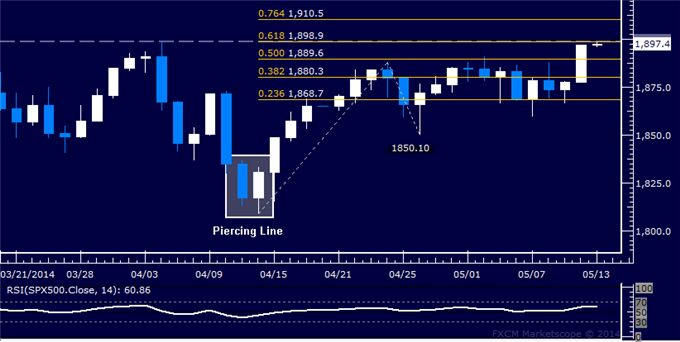
Daily Chart - Created Using FXCM Marketscope 2.0
GOLD TECHNICAL ANALYSIS – Prices are consolidating below resistance in the 1310.74-15.60 area, marked by the top of a descending Triangle chart formation and the 38.2% Fibonacci retracement. A break above that on daily closing basis targets the 50% level at 1330.18. The descending Triangle argues in favor of bearish continuation however (though confirmation is absent for now). Near-term support is at 1277.00, the Triangle bottom, followed by the April 24 low at 1268.40.
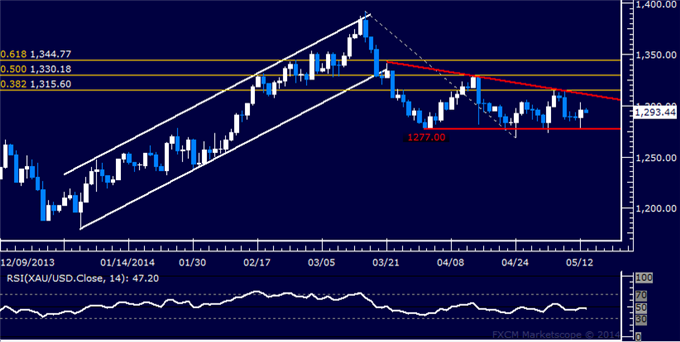
Daily Chart - Created Using FXCM Marketscope 2.0
CRUDE OIL TECHNICAL ANALYSIS – Prices are consolidating above the psychologically significant $100/barrel figure. Breaking below the 23.6% Fibonacci expansion at 99.67 exposes the 38.2% level at 98.76. Alternatively, a bounce above the 38.2% Fib retracement at 101.11 sees the next upside barrier at 101.85.

Daily Chart - Created Using FXCM Marketscope 2.0
--- Written by Ilya Spivak, Currency Strategist for DailyFX.com
To receive Ilya's analysis directly via email, please SIGN UP HERE
Contact and follow Ilya on Twitter: @IlyaSpivak
DailyFX provides forex news and technical analysis on the trends that influence the global currency markets.
Learn forex trading with a free practice account and trading charts from FXCM.
