US Dollar Bounces at Support, S&P 500 Turns Sharply Lower
THE TAKEAWAY: The US Dollar is staging an impressive recovery from support while the S&P 500 may have at last begun to validate bearish cues in technical positioning.
US DOLLAR TECHNICAL ANALYSIS– Prices are bouncing from support at 10420, the 23.6% Fibonacci retracement, pushing above falling trend line resistance (10454) to challenge the 14.6% Fib expansion at 10509. A break above that exposes the 23.6% expansion at 10569. Alternatively, a reversal below support targets the 38.2% retracement at 10324.

Daily Chart - Created Using FXCM Marketscope 2.0
S&P 500 TECHNICAL ANALYSIS – Prices broke lower as expected after carving out a bearish Rising Wedge chart pattern below resistance at 1576.10 the index’s record high. Sellers now challenge support at 1552.40, marked by the 23.6% Fibonacci retracement and a rising channel bottom. A break below that aims for the 38.2% level at 1539.20. The Wedge bottom, now at 1567.00, has been recast as near-term resistance.

8hr Chart - Created Using FXCM Marketscope 2.0
GOLD TECHNICAL ANALYSIS – Prices broke support at 1562.58, the 38.2% Fibonacci expansion, exposing the 50% level at 1545.78. The 1562.58 level has been recast as near-term resistance, with a reversal back above that eyeing the 23.6% Fib at 1583.37.
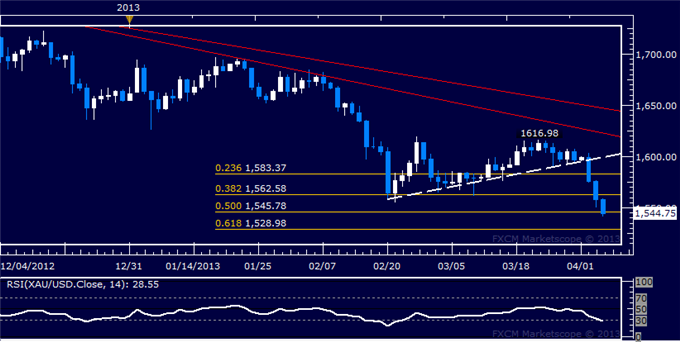
Daily Chart - Created Using FXCM Marketscope 2.0
CRUDE OIL TECHNICAL ANALYSIS– Prices are testing support at 94.47, the 38.2% Fibonacci retracement, with a break below that targeting the 50% level at 93.49. Near-term resistance is at 95.69, the 23.6% Fib. A reversal back above that eyes a falling trend line barrier at 97.54.
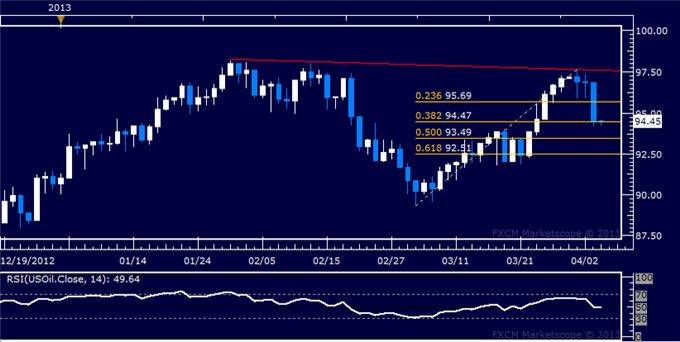
Daily Chart - Created Using FXCM Marketscope 2.0
Want to back-test your technical trading strategy? Download historical data here.
--- Written by Ilya Spivak, Currency Strategist for Dailyfx.com
To contact Ilya, e-mail ispivak@dailyfx.com. Follow Ilya on Twitter at @IlyaSpivak
To be added to Ilya's e-mail distribution list, please CLICK HERE
New to FX? Watch this Video. For live market updates, visit the Real Time News Feed
DailyFX provides forex news and technical analysis on the trends that influence the global currency markets.
Learn forex trading with a free practice account and trading charts from FXCM.
