US Dollar Chart Setup Hints a Pullback May Be Ahead
THE TAKEAWAY: The breakneck US Dollar rally launched last week has stalled at technical resistance, with prices now showing early signs of a possible pullback ahead.
Capitalize on Shifts in Market Mood with the DailyFX Speculative Sentiment Index.
US DOLLAR TECHNICAL ANALYSIS– Prices put in a Harami candlestick pattern below resistance at 10781, the 76.4% Fibonacci retracement, hinting a pullback may be ahead. Initial support is at 10721, the 61.8% level, with a drop beneath that eyeing the 50% Fib at 10673. Alternatively, a move above resistance aims for the May 29 swing high at 10877.
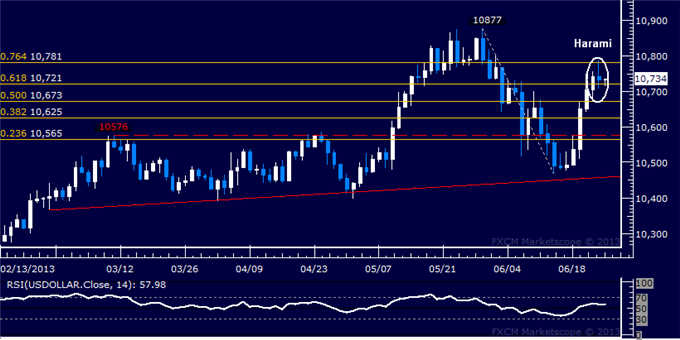
Daily Chart - Created Using FXCM Marketscope 2.0
S&P 500 TECHNICAL ANALYSIS – Prices broke support at 1585.80, the 76.4% Fibonacci expansion, with sellers now challenging the 100% level at 1564.60. A further push beneath that aims for the 123.6% Fib at 1543.40. Alternatively, a move back above 1585.80 exposes the 1600 figure.
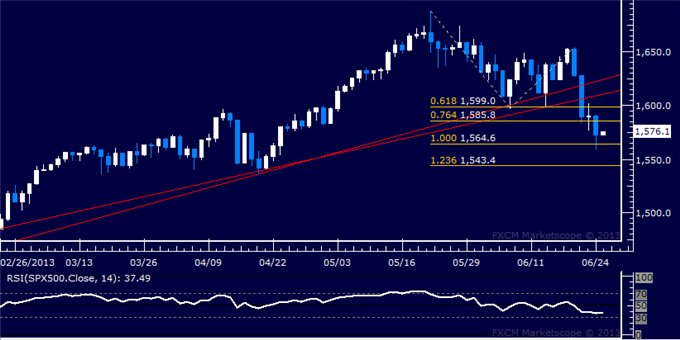
Daily Chart - Created Using FXCM Marketscope 2.0
GOLD TECHNICAL ANALYSIS – Prices are testing the 100% Fibonacci expansion at 1273.77, with a break beneath that exposing the 123.6% level at 1238.38. Early signs of positive RSI divergence hint a corrective bounce may be ahead, but confirmation is absent for the time being. Near-term resistance is at 1309.16, the 76.4% Fib, followed by the 61.8% expansion at 1331.05.

Daily Chart - Created Using FXCM Marketscope 2.0
CRUDE OIL TECHNICAL ANALYSIS– Prices put in a bullish Piercing Line candlestick pattern above support at a rising trend line set from mid-April, hinting a rebound may be ahead. Initial resistance is at 95.88, the 23.6% Fibonacci expansion, with a break above that exposing the 38.2% level at 97.87. Alternatively, move beneath trend line support (now at 93.69) exposes an upward-sloping barrier set from the May 1 low at 92.04, followed by the June 3 bottom at 91.23.
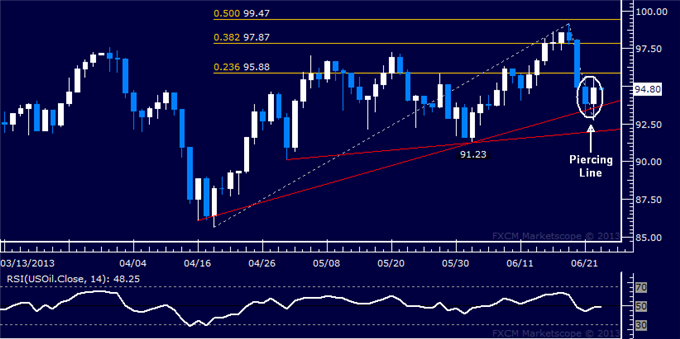
Daily Chart - Created Using FXCM Marketscope 2.0
--- Written by Ilya Spivak, Currency Strategist for Dailyfx.com
To contact Ilya, e-mail ispivak@dailyfx.com. Follow Ilya on Twitter at @IlyaSpivak
To be added to Ilya's e-mail distribution list, please CLICK HERE
New to FX? Watch this Video. For live market updates, visit the Real Time News Feed
DailyFX provides forex news and technical analysis on the trends that influence the global currency markets.
Learn forex trading with a free practice account and trading charts from FXCM.
