US Dollar Eyes June Low, SPX 500 Hints at Top Taking Shape
Talking Points
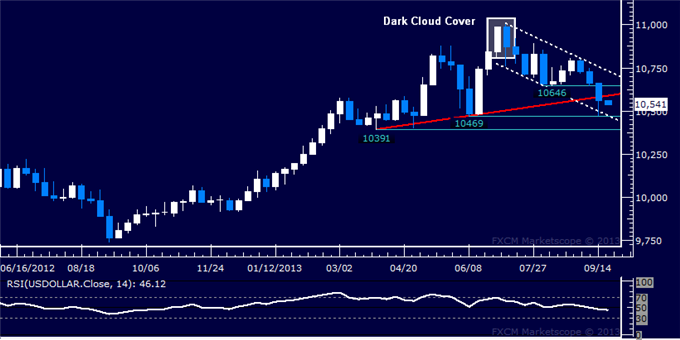
US Dollar Poised to Test June Low After Trend Line Break
S&P 500 Chart Positioning Reveals Bearish Reversal Clues
Gold Recoils from Resistance, Inches to Pre-FOMC Bottom
To receive Ilya's analysis directly via email, please SIGN UP HERE
Can’t access to the Dow Jones FXCM US Dollar Index? Try the USD basket on Mirror Trader. **
US DOLLAR TECHNICAL ANALYSIS – Prices broke support at a rising trend line set from late March, exposing the June bottom at 10469. A push beneath that targets 10391. The trend line – now at 10592 – has been recast as resistance, with a turn back above that targeting 10646.
Weekly Chart - Created Using FXCM Marketscope 2.0
** The Dow Jones FXCM US Dollar Index and the Mirror Trader USD basket are not the same product.
S&P 500 TECHNICAL ANALYSIS – Prices are testing resistance at 1713.30, the 23.6% Fibonacci expansion. A break above this barrier targets a long-term channel top set from mid-2011, now at 1748.40. Negative RSI divergence warns of ebbing bullish momentum and hints a reversal downward may be brewing however. Near-term trend line support is now at 1647.20.

Weekly Chart - Created Using FXCM Marketscope 2.0
GOLD TECHNICAL ANALYSIS – Prices recoiled from support-turned-resistance at the underside of a rising channel set from the late-June swing bottom. A break through the 1341.60-47.52 area, marked by a horizontal pivot and the 23.6% Fibonacci retracement, has exposed the 38.2% level at 1320.86. Pushing further beneath that eyes the 50% Fib at 1304.10. Alternatively, a move back above 1347.52 targets the channel top (now at 1383.00) anew.

Daily Chart - Created Using FXCM Marketscope 2.0
CRUDE OIL TECHNICAL ANALYSIS– Prices are testing rising trend line support set from mid-April, now at 104.14. A break below that initially exposes the 38.2% Fibonacci retracement at 102.05. Near-term resistance is at 105.93, the 23.6% level.

Weekly Chart - Created Using FXCM Marketscope 2.0
--- Written by Ilya Spivak, Currency Strategist for DailyFX.com
Contact and follow Ilya on Twitter: @IlyaSpivak
For live market updates, visit the Real Time News Feed
DailyFX provides forex news and technical analysis on the trends that influence the global currency markets.
Learn forex trading with a free practice account and trading charts from FXCM.
