US Dollar Meets Support, S&P 500 Rally Pauses Below 1700
THE TAKEAWAY: The US Dollar has descended to test another level of chart support while the S&P 500 rally has paused for a breather below the 1700.00 figure.
Don’t have access the Dow Jones FXCM US Dollar Index? Try the USD basket via Mirror Trader as an alternative. **
US DOLLAR TECHNICAL ANALYSIS – Prices continue to play out a bearish reversal identified two weeks ago, taking out support in the 10790-803 area to expose the 50% Fibonacci retracement at 10739. A further push beneath that targets the 61.8% level at 10675. Alternatively, a reversal back above 10803 sees trend line resistance at 10826.
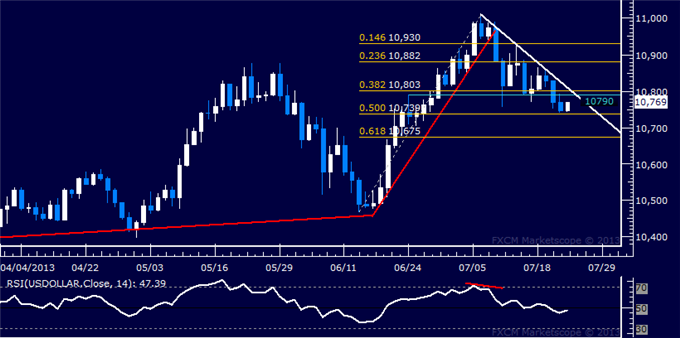
Daily Chart - Created Using FXCM Marketscope 2.0
** The Dow Jones FXCM USDollar Index and the Mirror Trader USD basket are not the same product.
S&P 500 TECHNICAL ANALYSIS – Prices broke above resistance at 1687.40, the May 22 swing high, overturning bearish cues noted last week and exposing the 100% Fibonacci expansion at 1710.90. The 1687.40 level has been recast as near-term support, reinforced by a rising trend line set from late June. A reversal back below that eyes the 76.4% level at 1675.10.
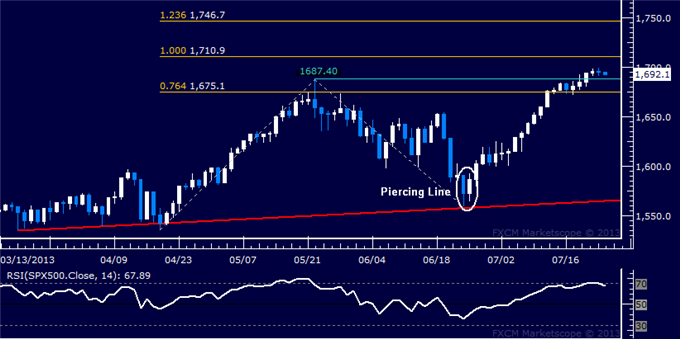
Daily Chart - Created Using FXCM Marketscope 2.0
GOLD TECHNICAL ANALYSIS – Prices broke resistance at 1334.08, the 50% Fibonacci retracement, and moved to challenge the top of a rising channel set from late June (1355.13). A further push higher beyond that aims for the 61.8% retracement at 1370.40. The 1334.08 level has been recast as near-term support, with a turn back beneath that eyeing the 38.2% level at 1297.75.
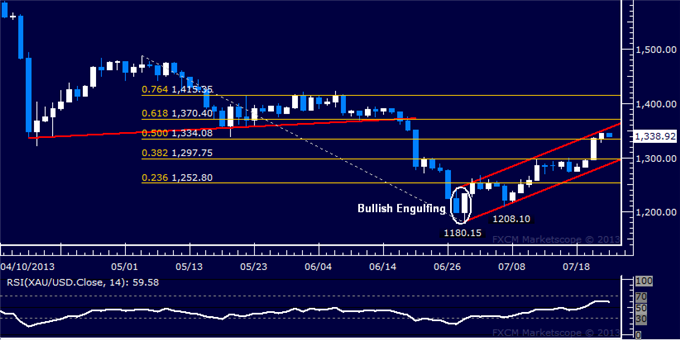
Daily Chart - Created Using FXCM Marketscope 2.0
CRUDE OIL TECHNICAL ANALYSIS – Prices turned lower as expected, completing a bearish Evening Star candlestick pattern. Initial support is at 105.06, with a break below that targeting the 38.2% level at 102.70. Near-term resistance is at 108.89, the July 19 high.

Daily Chart - Created Using FXCM Marketscope 2.0
--- Written by Ilya Spivak, Currency Strategist for Dailyfx.com
To contact Ilya, e-mail ispivak@dailyfx.com. Follow Ilya on Twitter at @IlyaSpivak
To be added to Ilya's e-mail distribution list, please CLICK HERE
New to FX? Watch this Video. For live market updates, visit the Real Time News Feed
DailyFX provides forex news and technical analysis on the trends that influence the global currency markets.
Learn forex trading with a free practice account and trading charts from FXCM.
