US Dollar Rally Poised to Resume, SPX 500 at Risk of Reversal
Talking Points:
US Dollar Appears Poised to Resume its Advance After a Correction
S&P 500 Looks Vulnerable After Prices Set Yet Another Record High
Gold, Crude Oil Technical Positioning Hints Gains May be Ahead
Can’t access to the Dow Jones FXCM US Dollar Index? Try the USD basket on Mirror Trader. **
US DOLLAR TECHNICAL ANALYSIS – Prices pulled back to retest resistance-turned-support at 10565, marked by the top of a falling channel set from July and a horizontal barrier in play since late September. A break below this eyes the November 6 low at 10492. Near-term resistance is at 10653, the 23.6% Fibonacci expansion, with a push above that targeting the 38.2% level at 10839.

Daily Chart - Created Using FXCM Marketscope 2.0
** The Dow Jones FXCM US Dollar Index and the Mirror Trader USD basket are not the same product.
S&P 500 TECHNICAL ANALYSIS – Prices are testing resistance at 1790.50, 38.2%Fibonacci expansion, with a break higher targeting the 50% level at 1806.10. Negative RSI divergence warns of ebbing bullish momentum however, warning of a possible reversal in the works. Near-term support is at 1771.30, the 23.6% Fib. A reversal beneath that eyes the November 8 low at 1740.10.
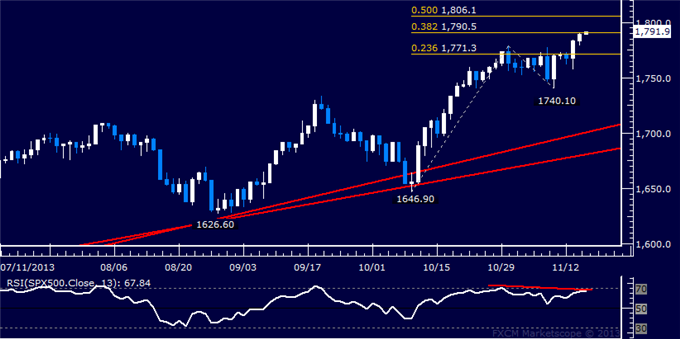
Daily Chart - Created Using FXCM Marketscope 2.0
GOLD TECHNICAL ANALYSIS – Prices started to drift higher as expected after showing a bullish Piercing Line candlestick pattern. Initial resistance is at 1294.51, marked by the 23.6% Fibonacci retracement and reinforced by the top of a minor falling channel. A break above that initially exposes the 38.2% Fib at 1321.09. Near-term support is at 1261.28, the November 12 low.
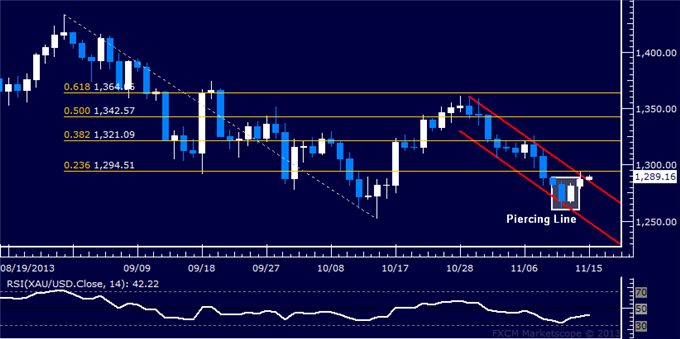
Daily Chart - Created Using FXCM Marketscope 2.0
CRUDE OIL TECHNICAL ANALYSIS– Prices began to edge higher as expected after putting in an Inverted Hammer candlestick above support at 93.05, the November 5 low. Positive RSI divergence bolsters the case for an upside scenario. Initial resistance is at 95.85, marked by the 14.6% Fibonacci expansion and reinforced by the top of a falling channel set from late August. A break higher initially exposes the 23.6% level at 97.57. Alternatively, a move below 93.05 targets the channel bottom at 91.15.
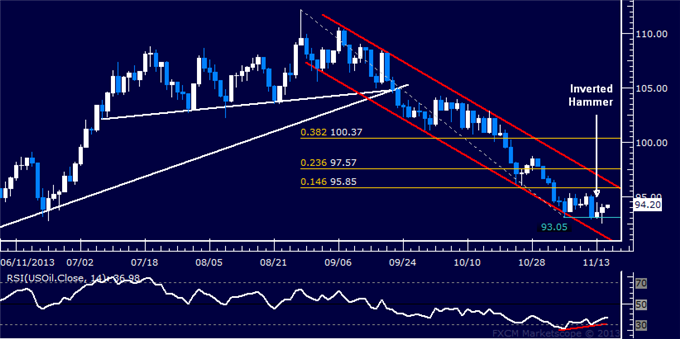
Daily Chart - Created Using FXCM Marketscope 2.0
--- Written by Ilya Spivak, Currency Strategist for DailyFX.com
To receive Ilya's analysis directly via email, please SIGN UP HERE
Contact and follow Ilya on Twitter: @IlyaSpivak
DailyFX provides forex news and technical analysis on the trends that influence the global currency markets.
Learn forex trading with a free practice account and trading charts from FXCM.
