US Dollar Technical Analysis 04.18.2013
US Dollar Technical Analysis– Prices continue to consolidate in a choppy range below resistance at 10547, the 23.6% Fibonacci expansion. A break above that aims for the 38.2% level at 10643. Trend line support is at 10438, with a reversal beneath that eyeing the April 2 low at 10391.
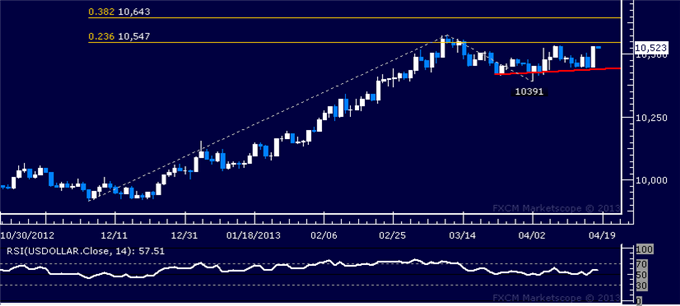
Daily Chart - Created Using FXCM Marketscope 2.0
Want to back-test your technical trading strategy? Download the historical data here.
--- Written by Ilya Spivak, Currency Strategist for Dailyfx.com
To contact Ilya, e-mail ispivak@dailyfx.com. Follow Ilya on Twitter at @IlyaSpivak
To be added to Ilya's e-mail distribution list, please CLICK HERE
New to FX? Watch this Video. For live market updates, visit the Real Time News Feed
DailyFX provides forex news and technical analysis on the trends that influence the global currency markets.
Learn forex trading with a free practice account and trading charts from FXCM.
