US Dollar Technical Analysis 05.09.2013
US Dollar Technical Analysis– Prices are retesting recently broken resistance-turned-support at 10488, the 14.6% Fibonacci retracement. A break below that targets the 10424-28 area, marked by the 23.6% level and the March 22 close. Near-term resistance is at 10576, the March 11 high, with a reversal above that targeting the 38.2% Fib expansion at 10655.
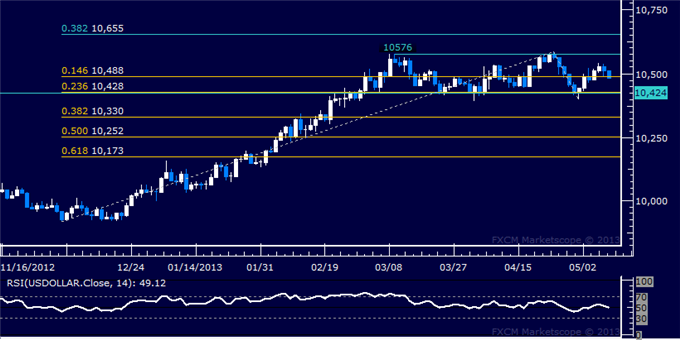
Daily Chart - Created Using FXCM Marketscope 2.0
--- Written by Ilya Spivak, Currency Strategist for Dailyfx.com
To contact Ilya, e-mail ispivak@dailyfx.com. Follow Ilya on Twitter at @IlyaSpivak
To be added to Ilya's e-mail distribution list, please CLICK HERE
New to FX? Watch this Video. For live market updates, visit the Real Time News Feed
DailyFX provides forex news and technical analysis on the trends that influence the global currency markets.
Learn forex trading with a free practice account and trading charts from FXCM.
