US Dollar Technical Analysis 06.04.2013
US Dollar Technical Analysis– Prices moved lower as expected, taking out the 38.2% Fibonacci retracement level at 10694 and exposing the 50% Fib at 10638. A further push beneath that eyes the 61.8% level at 10582. The 10694 mark has been recast as near-term resistance.
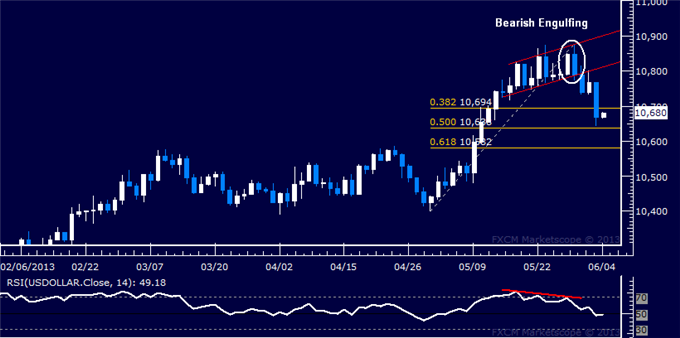
Daily Chart - Created Using FXCM Marketscope 2.0
--- Written by Ilya Spivak, Currency Strategist for Dailyfx.com
To contact Ilya, e-mail ispivak@dailyfx.com. Follow Ilya on Twitter at @IlyaSpivak
To be added to Ilya's e-mail distribution list, please CLICK HERE
New to FX? Watch this Video. For live market updates, visit the Real Time News Feed
DailyFX provides forex news and technical analysis on the trends that influence the global currency markets.
Learn forex trading with a free practice account and trading charts from FXCM.
