US Dollar Technical Analysis: Trend Support at Risk Anew
US Dollar Technical Analysis– Prices moved lower as expected after putting in a Bearish Engulfing candlestick pattern. A mild recovery faltered at resistance marked by the 38.2% Fibonacci retracement at 10655. Sellers now challenge a key support cluster in the 10510-576 area, marked by a longer-term 38.2% Fib, the March 8 high, and a rising trend line set from mid-December 2012. A drop beneath that initially aims for the 50% level at 10397.
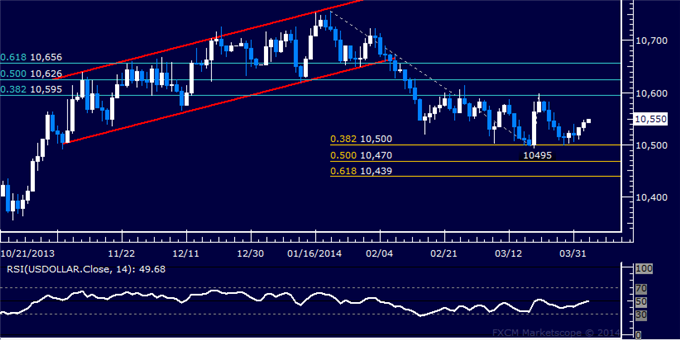
Daily Chart - Created Using FXCM Marketscope 2.0
--- Written by Ilya Spivak, Currency Strategist for Dailyfx.com
To contact Ilya, e-mail ispivak@dailyfx.com. Follow Ilya on Twitter at @IlyaSpivak
To be added to Ilya's e-mail distribution list, please CLICK HERE
New to FX? Watch this Video. For live market updates, visit the Real Time News Feed
DailyFX provides forex news and technical analysis on the trends that influence the global currency markets.
Learn forex trading with a free practice account and trading charts from FXCM.
