US Dollar Tests Trend-Defining Resistance, Crude Oil Launches Rebound
Talking Points:
US Dollar Flirting with Trend-Defining Resistance Level
S&P 500 Probes Higher, Falls Short of Technical Break
Crude Oil Launches Recovery, Probes Back Above $102
Can’t access to the Dow Jones FXCM US Dollar Index? Try the USD basket on Mirror Trader. **
US DOLLAR TECHNICAL ANALYSIS – Prices may be in the process of setting a double bottom at 10375, the October 22 close. Initial confirmation requires a breach of resistance is at 10465, marked by the top of a falling channel that has guided the greenback lower since the beginning of the year. A daily close above this barrier initially targets horizontal support-turned-resistance at 10495.
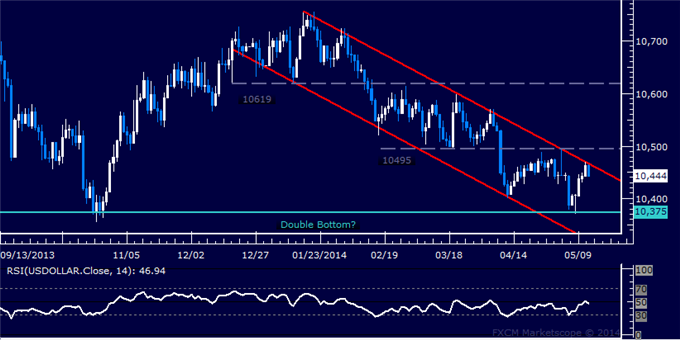
Daily Chart - Created Using FXCM Marketscope 2.0
** The Dow Jones FXCM US Dollar Index and the Mirror Trader USD basket are not the same product.
S&P 500 TECHNICAL ANALYSIS – Prices rebounded as expected after putting in a Piercing Line candlestick pattern. The index launched higher to test resistance in the 1898.90-99.10 area marked by the 61.8% Fibonacci expansion and the April 4 high. A break above this barrier on a daily closing basis exposes the 76.4% level at 1910.50. Alternatively, a reversal below support at 1889.60, the 50% Fib, targets the 38.2% expansion at 1880.30.

Daily Chart - Created Using FXCM Marketscope 2.0
GOLD TECHNICAL ANALYSIS – Prices are consolidating below resistance in the 1309.71-15.60 area, marked by the top of a descending Triangle chart formation and the 38.2% Fibonacci retracement. A break above that on daily closing basis targets the 50% level at 1330.18. The descending Triangle argues in favor of bearish continuation however (though confirmation is absent for now). Near-term support is at 1277.00, the Triangle bottom, followed by the April 24 low at 1268.40.
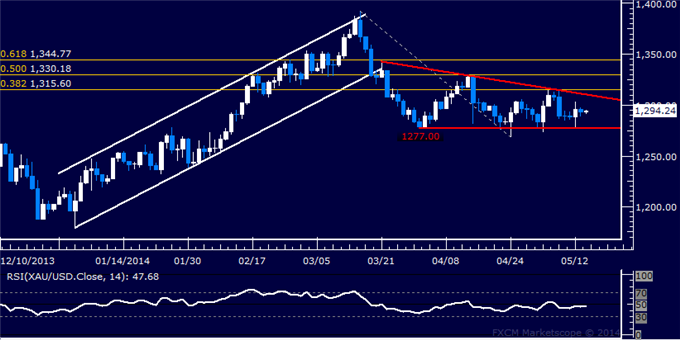
Daily Chart - Created Using FXCM Marketscope 2.0
CRUDE OIL TECHNICAL ANALYSIS – Prices shot higher, clearing resistance at 101.85 marked by the 50% Fibonacci retracement. Buyers now aim to challenge the 61.8% level at 102.58, with a push above that eyeing the underside of a previously broken rising trend line at 102.87. Alternatively, a reversal back below 101.85 eyes the 38.2% Fib at 101.11.

Daily Chart - Created Using FXCM Marketscope 2.0
--- Written by Ilya Spivak, Currency Strategist for DailyFX.com
To receive Ilya's analysis directly via email, please SIGN UP HERE
Contact and follow Ilya on Twitter: @IlyaSpivak
DailyFX provides forex news and technical analysis on the trends that influence the global currency markets.
Learn forex trading with a free practice account and trading charts from FXCM.
