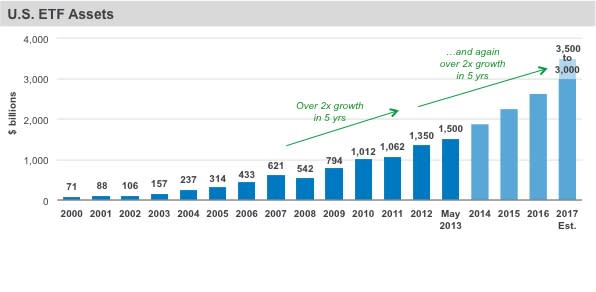
US ETF Assets Could More Than Double by 2017
Lately, it seems we can’t go more than a few days without seeing a headline about the phenomenal growth of the ETF industry. Fast on the heels of last year’s record setting global inflows, ETFs in 2013 are already on pace to outdo themselves once again. In the US alone, ETF assets grew from $100 billion in 2002 to over $1.3 trillion in 2012. And by our calculation, US ETF assets could more than double over the next five years, reaching $3.5 trillion by 2017 [For more ETF analysis, make sure to sign up for our free ETF newsletter].
what is causing this extraordinary growth? In the US, we believe the fire is being fueled by 6 key drivers:
Growth of the advised market. According to a recent survey conducted by Cerulli, 98% of advisors currently using ETFs plan to either maintain or increase their allocations in the future, while the number of advisors that report using active and passive management together has nearly doubled since 2010 to 60%. But ETFs only have a 7% share of wallet among these advisors, compared with 37% for mutual funds, illustrating a significant opportunity for growth [also see Homebuilders ETFs Rise Despite Housing Data].
Growth of the self-directed market. Self-directed investors make up the fastest growing part of the retail market. Currently, only about 4% of self-directed assets are invested in ETFs, but when you consider this number has doubled since 2008, you can spot a growing trend among this group.
Increased institutional usage. Institutional investors have been, and we expect will continue to be, a huge driver of ETF growth. Nine out of ten institutional ETF users plan to maintain or increase their level of ETF investments this year. In addition, institutions are discovering new ways to use ETFs; for example, transitioning a fixed income portfolio from thousands of bond holdings to just a handful of ETF exposures [see The Cheapest ETF for Every Investment Objective].
Core exposures. Historically, we’ve seen many investors use ETFs to take positions in specific categories, but more and more we’re witnessing investors in both the retail and institutional space using ETFs for what we’d call “core exposures.” While we’re still at the beginning of the adoption curve with just over $600 billion in core ETF assets, the growth of assets in this space – and opportunity for more – has been notable.
Fixed income. The US fixed income market is more than twice the size of the equity market, and yet fixed income ETF penetration is only one tenth the level of equity ETF penetration. And as circumstances such as illiquid markets and lower dealer bond inventories continue to inspire fixed income investors to find new ways to invest, we believe the fixed income ETF category will continue to grow in size [see also Sector ETFs: Biggest Winners & Losers YTD].
New products and new segments. From the broad market to very narrow exposures, it seems there’s an ETF for everything these days. But as providers continue to innovate in order to meet client needs, there are still more areas that should see greater adoption in the coming years. Fast- growing categories such as low volatility and solutions-based wrap ETFs are great examples.
We’ll be keeping a close eye on all six of these drivers, but no matter which part of the industry leads the charge, we feel that the future is incredibly bright for US ETFs. Which likely means more headlines from us and others in the near future.
[For more ETF analysis, make sure to sign up for our free ETF newsletter]
Sources: BlackRock, Bloomberg, Greenwich Associates
Click here to read the original article on ETFdb.com.
Related Posts:
No Related Posts


