USD/CAD Daily Forecast – 200-day SMA Restraining Pair’s Upward Price Actions
In the early Asian session, the USD/CAD pair was trading within 1.3120/40 higher range levels. After marking the last day’s high near 1.3145 level, the pair appeared gradually to lose grip. Yesterday’s upliftment came around as the US Dollar Index started gaining strength. The Greenback got support as its significant rivals majorly Fiber and Cable was losing ground amid weaker economic data.
As per the technicals, the USD Index had initiated the flight to recovery since the start of July.
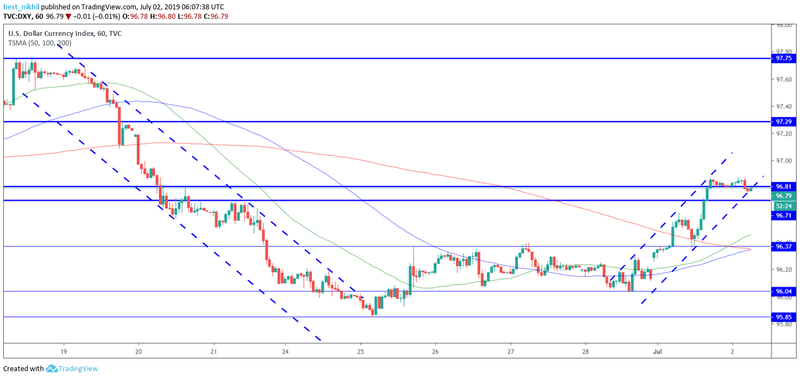
The Index seems to travel quite smoothly sustaining the uptrend motion today. The US Dollar Index had already moved above, breaching the 96.71 and 96.81 resistance lines. The 200-day SMA was heading south, bestowing the Greenback movements. On the upper side, targets stand near 97.29 and 97.75 resistance levels.
The second primary driver for the escalation in the Loonie pair was the slumping Oil prices. The commodity prices dropped despite the OPEC decision to extend supply cuts until next March. Investors have gone unnerved as they smelt demand worries on the backdrop of rising US-Sino trade uncertainties. Today, the Crude Oil WTI Futures was trading near $59.09 bbl at around 05:40 GMT. Anyhow, the OPEC-led supply cuts seemed to lose steam, and economic slowdown concerns appeared to take charge of the Crude price actions.
Significant Economic Events
The only noteworthy event on the US side remains the Fed New York President Williams Speech at 10:35 GMT. The President would join a panel of discussion over Global Economy and Monetary Policy Outlook in Zurich, Switzerland.
At around 13:30 GMT, the Canadian June Markit Manufacturing PMI would come out. The market appears to stay slightly bearish this time, expecting 49.0 points over the previous 49.1 points.
Loonie traders also eye over the upcoming API Weekly Crude Oil Stock Change data release computed since June 28. This Oil report would act as a catalyst for the commodity’s daily volatility. The API data had recorded -7.55 million in the last time.
Technical Analysis
1-Hour Chart
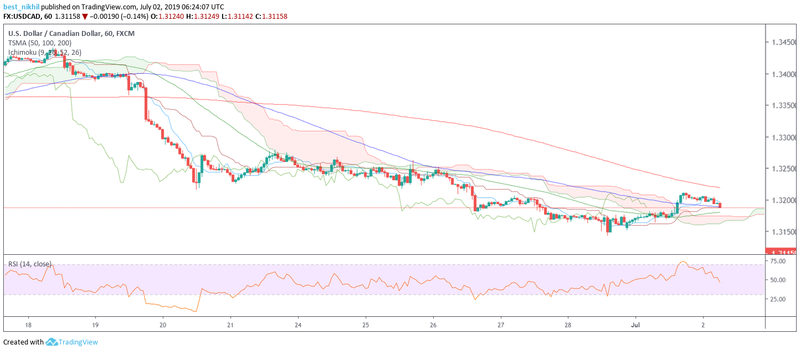
Last day, the USD/CAD pair had broken the Ichimoku Clouds which acted as a strong resistance restraining pair’s movements. After reaching above the Clouds, the traders hoped for some rigorous upward movements. However, the real scenario appears a bit contrasting. The significant 200-day SMA continued to move well above the Loonie pair, calling the entry for bears. The pair was heading downwards and might soon get hit with the Clouds. Anyhow, traders can expect a short term upward drift in the price action as pair stay above the 50-day and 100-day SMA.
4-Hour Chart
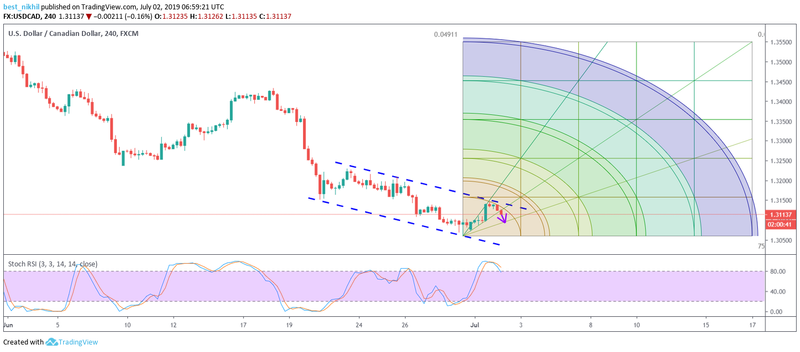
The main trend on the broader chart view also remained bearish. The pair might rebound from the lower Gann trend line, on the further downward movement. Though the Stochastic RSI indicated above 80 mark, the head of the indicator was looking southwards.
This article was originally posted on FX Empire
