USD/CHF Technical Analysis – Triangle Floor Under Pressure
To receive Ilya's analysis directly via email, please SIGN UP HERE
Talking Points:
USD/CHF Technical Strategy: Flat
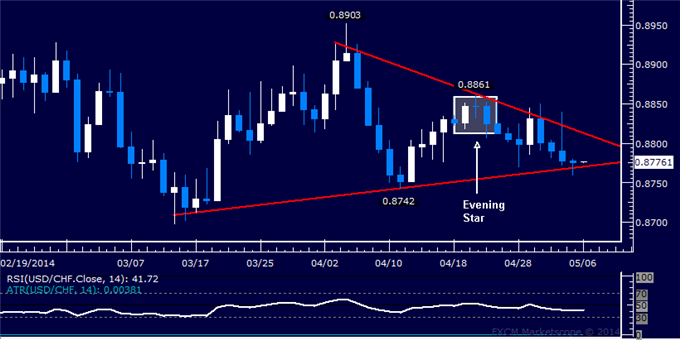
Support: 0.8770 (Triangle floor), 0.8742 (Apr 11 low)
Resistance:0.8812 (Triangle top), 0.8861 (Apr 22 high)
The US Dollar declined against the Swiss Franc as expected after prices produced a bearish Evening Star candlestick pattern. Prices are tracing out a Triangle chart formation, a setup that carries bearish continuation implications if completed on a daily close below the pattern’s lower boundary (now at 0.8770). That would initially expose the April 11 low at 0.8742. Alternatively, a break above the Triangle top at 0.8812 exposes the April 22 high at 0.8861 at first.
Risk/reward considerations argue against taking a short position with prices trading in close proximity to relevant support. We will remain on the sidelines for the time being, waiting for a more attractive trading opportunity to present itself.
Confirm your chart-based trade setups with the Technical Analyzer. New to FX? Start Here!
Daily Chart - Created Using FXCM Marketscope 2.0
--- Written by Ilya Spivak, Currency Strategist for DailyFX.com
DailyFX provides forex news and technical analysis on the trends that influence the global currency markets.
Learn forex trading with a free practice account and trading charts from FXCM.
