USD/JPY Forex Technical Analysis – Weekly Chart Strenghtens Over 110.710, Weakens Under 110.662
The Dollar/Yen closed lower last week for the fourth week out of five. Safe-haven buying and position-squaring in anticipation of a change in policy by the Bank of Japan is driving the Japanese Yen higher.
Last week, the USD/JPY settled at 110.506, down 0.427 or -0.38%.
Weekly Technical Analysis
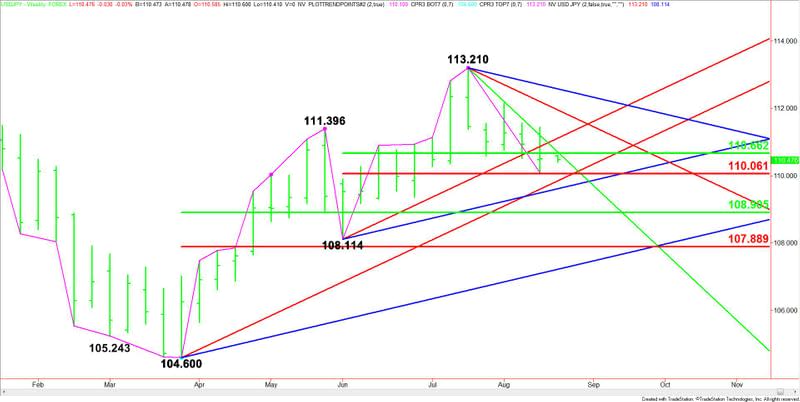
The main trend is up according to the weekly swing chart. However, momentum has been trending lower since the 113.210 main top the week-ending July 20. The main trend changes to down on a move through 108.114. A trade through 113.210 will negate the closing price reversal top and signal a resumption of the uptrend.
The minor trend is down. This is helping to contribute to the downside momentum. A trade through 112.152 will change the minor trend to up and shift momentum to the upside.
The short-term range is 108.114 to 113.210. The USD/USD is currently trading inside its retracement zone at 110.662 to 110.061. This zone is important because buyers are going to try to form a secondary higher bottom on a test of this area. Sellers are going to try to drive the Forex pair through this zone.
The main range is 104.600 to 113.210. If the downside momentum continues then look for an eventual test of its retracement zone at 108.905 to 107.889. Buyer could show up on a test of this zone in an effort to defend the main bottom at 108.114.
Weekly Technical Forecast
Based on last week’s close at 110.506, the longer-term direction of the USD/JPY this week is likely to be determined by trader reaction to the 50% level at 110.662 and the 61.8% level at 110.061.
A sustained move over 110.662 will indicate the presence of buyers. Taking out the downtrending Gann angle at 110.710 could trigger an acceleration into an uptrending Gann angle at 111.114. Overtaking this angle will indicate the buying is getting stronger with 111.960 the next target angle.
A sustained move under 110.662 will signal the presence of sellers. This could lead to a spike into 110.061, followed by a pair of uptrending Gann angles at 109.850 and 109.614.
The weekly chart opens up to the downside under 109.614 so don’t be surprised by an acceleration into the main 50% level at 108.905.
This article was originally posted on FX Empire
