USD/JPY Forex Technical Analysis – Strengthens Over 112.085, Weakens Under 111.770
The Dollar/Yen closed higher last week, boosted by strong U.S. economic data and a sharp rise in U.S. Treasury yields. The Forex pair surged on Friday after the U.S. reported stronger-than-expected retail sales. The news offset lower-than-expected producer and consumer inflation data, reported earlier in the week.
Last week, the USD/JPY settled at 112.072, up 0.989 or +0.89%.
Weekly Technical Analysis
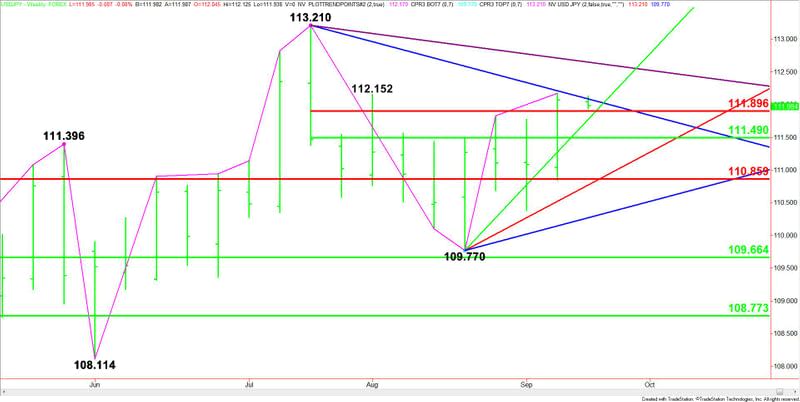
The main trend is up according to the weekly swing chart. A trade through 113.210 will signal a resumption of the uptrend. The main trend will change to down on a move through 109.770.
The long-term retracement zone at 110.859 to 109.664 is support. Trading above this zone is helping to give the Forex pair an upside bias.
The short-term range is 113.210 to 109.770. Its retracement zone at 111.490 to 111.896 is controlling the near-term direction of the market. The 50% and 61.8% levels are also support. Furthermore, trading above this zone is helping to give the market an upside bias.
Weekly Technical Forecast
Based on last week’s price action and the close at 112.072, the direction of the USD/JPY this week is likely to be determined by trader reaction to the downtrending Gann angle at 112.085.
A sustained move under 112.085 will indicate the presence of sellers. The first target is the short-term Fibonacci level at 111.896, followed by the short-term uptrending Gann angle at 111.770.
If 111.70 fails as support then look for a potential break into the short-term 50% level at 111.490. The daily chart starts to open up to the downside under this level with the next major downside target coming in at 110.859, followed by 110.770.
A sustained move over 112.085 will indicate the buying is getting stronger. If this move creates enough upside momentum, the rally could extend into the next downtrending Gann angle at 112.648. This is the last potential resistance angle before the 113.210 main top.
Basically, look for a strong upside bias to develop on a sustained move over the downtrending Gann angle at 112.085. A strong downside bias is likely to develop on a sustained move under the uptrending Gann angle at 111.770.
This article was originally posted on FX Empire
