USD/JPY Forex Technical Analysis – Strengthens Over 109.688, Weakens Under 109.634
The Dollar/Yen is trading higher on Monday on light volume due to a U.S. bank holiday. The market is being underpinned by a mixed stock market performance in Asia and advancing markets in Europe. Both moves suggests a slight increase in demand for higher-yielding assets. The U.S. Treasury markets are closed so Dollar/Yen traders are getting no guidance from the direction of Treasury yields.
At 10:18 GMT, the USD/JPY is trading 109.877, up 0.093 or +0.09%.
Earlier in the session, Japan’s Cabinet Office data revealed the Japanese economy shrunk at an annualized pace of 6.3% in the three months that ended in December. Analysts in a Reuters poll were predicting an annual decline of 3.7%. On-quarter, GDP fell 1.6%.
Daily Technical Analysis
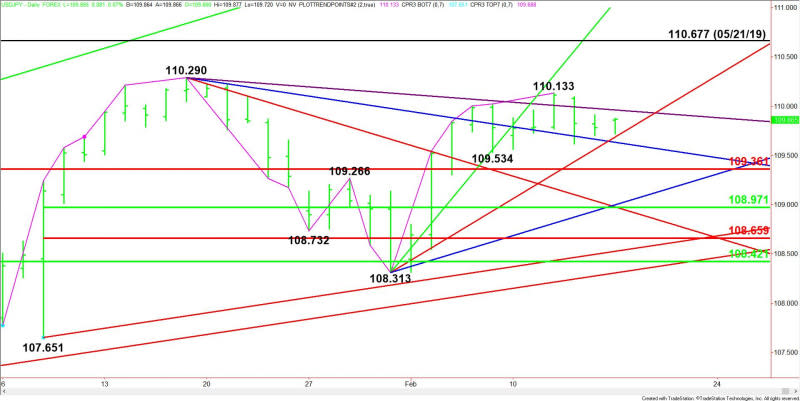
The main trend is up according to the daily swing chart. A trade through 110.133 will signal a resumption of the uptrend. The main trend will change to down if traders take out 108.313.
The minor trend is also up. A move through 110.133 will indicate the buying is getting stronger. A move through 109.534 will change the minor trend to down. This will also shift momentum to the downside.
The first support is a long-term Fibonacci level at 109.361.
Daily Technical Forecast
Since the main trend is up, our bias is to the upside. Based on the current price at 109.877, the direction of the USD/JPY the rest of the session on Monday is likely to be determined by trader reaction to the uptrending Gann angle at 109.688 and the downtrending Gann angle at 109.634.
Bullish Scenario
A sustained move over 109.688 will indicate the presence of buyers. If this move creates enough upside momentum then look for the rally to possibly extend into the downtrending Gann angle at 109.962.
Taking out 109.962 will indicate the buying is getting stronger. This could trigger a surge into the minor top at 110.133, followed by the main top at 110.290.
Bearish Scenario
A failure to hold above 109.688 will be the first sign of weakness. Crossing to the weak side of the downtrending Gann angle at 109.634 will indicate the selling is getting stronger. If this move creates enough downside momentum then look for a potential break into the major Fibonacci level at 109.361.
This article was originally posted on FX Empire
More From FXEMPIRE:
Oil Price Fundamental Daily Forecast – Countries Cutting Growth Outlooks Can’t Be Good for Demand
Silver Price Forecast – Silver Slowly Moves Higher and Remains Prepped to Strengthen
NZD/USD Forex Technical Analysis – Strengthens Over .6455, Weakens Under .6441
GBP/USD Daily Forecast – Recovery Rally Blocked at 1.3050 Resistance
AUD/USD Forex Technical Analysis – Holding Pivot at .6718 Gives Aussie Slight Upside Bias
