USD/JPY Technical Analysis: Support Seen Above 98.00
USD/JPY Technical Analysis - Prices are pulling back from falling trend line resistance set from late May. Initial support is at 98.56, the 38.2% Fibonacci retracement, with a break below that targeting the 50% mark at 96.74. Alternatively, a push above the trend line (now at 100.88) initially aims for the July 8 swing high at 101.52.
Confirm your chart-based trade setups with the Technical Analyzer.
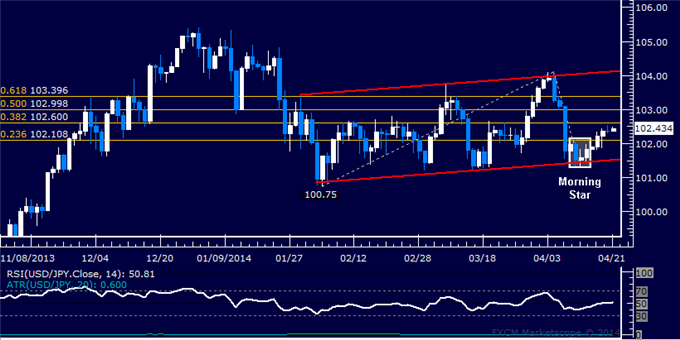
Daily Chart - Created Using FXCM Marketscope 2.0
--- Written by Ilya Spivak, Currency Strategist for Dailyfx.com
To contact Ilya, e-mail ispivak@dailyfx.com. Follow Ilya on Twitter at @IlyaSpivak
To be added to Ilya's e-mail distribution list, please CLICK HERE
New to FX? Watch this Video. For live market updates, visit the Real Time News Feed
DailyFX provides forex news and technical analysis on the trends that influence the global currency markets.
Learn forex trading with a free practice account and trading charts from FXCM.
